NOAA & Meteor APT and LRPT RECEPTION
![]()
“It pays to keep an open mind, but not so open your brains fall out.”
― Carl Sagan
Receiving NOAA APT (Automatic Picture Transmission) and Meteor M2-3 LRPT Satellite Imagery.
NOTE this Page has been updated as of 06/30/2023 to reflect that Meteor M N0. 2-3 is in Orbit and is transmitting on LRPT and HRPT
Table of contents
- What Is APT Reception
- Hardware
- How to build a QFH Antenna
- Software
- Recommended Guides and groups
- WxtoImg Documentation
- SDR# and WxtoImg Settings
- Building Wide Area Composites with WXtoImg
- Wxtoimage Global Imagery
- Decoding Meteor Satellites
- Other Software options
Automatic Picture Transmission
The Automatic Picture Transmission (APT) system is an analog image transmission system developed for use on weather satellites. It was introduced in the 1960s and over five decades has provided image data to relatively low-cost user stations at locations in most countries of the world. A user station anywhere in the world can receive local data at least twice a day from each satellite as it passes nearly overhead. Currently, I receive from these Polar-Orbiting Satellites, US NOAA 15,18, and 19, and Russian Meteor M-2-3 Transmits via LRPT (Low Rate Picture Transmission) and HRPT (High Rate Picture Transmission) NOTE M2-2 is currently experiencing an anomaly and is not transmitting on APT frequencies, only HRPT.
I have my system up and running 24/7, and have both Meteor captures and NOAA captures all set to run automatically with the hardware and software listed below. It only takes minimal effort to check the system from time to time. In fact, I control the whole computer system remotely from either my main desktop computer or my smartphone utilizing Google Remote Desktop
For Hardware I am running an older desktop computer, running Windows 10 64bit with a 3.20 GHz processor and 4GB ram with a UPS battery backup, and the following USB RTL-SDR dongles and accessories:
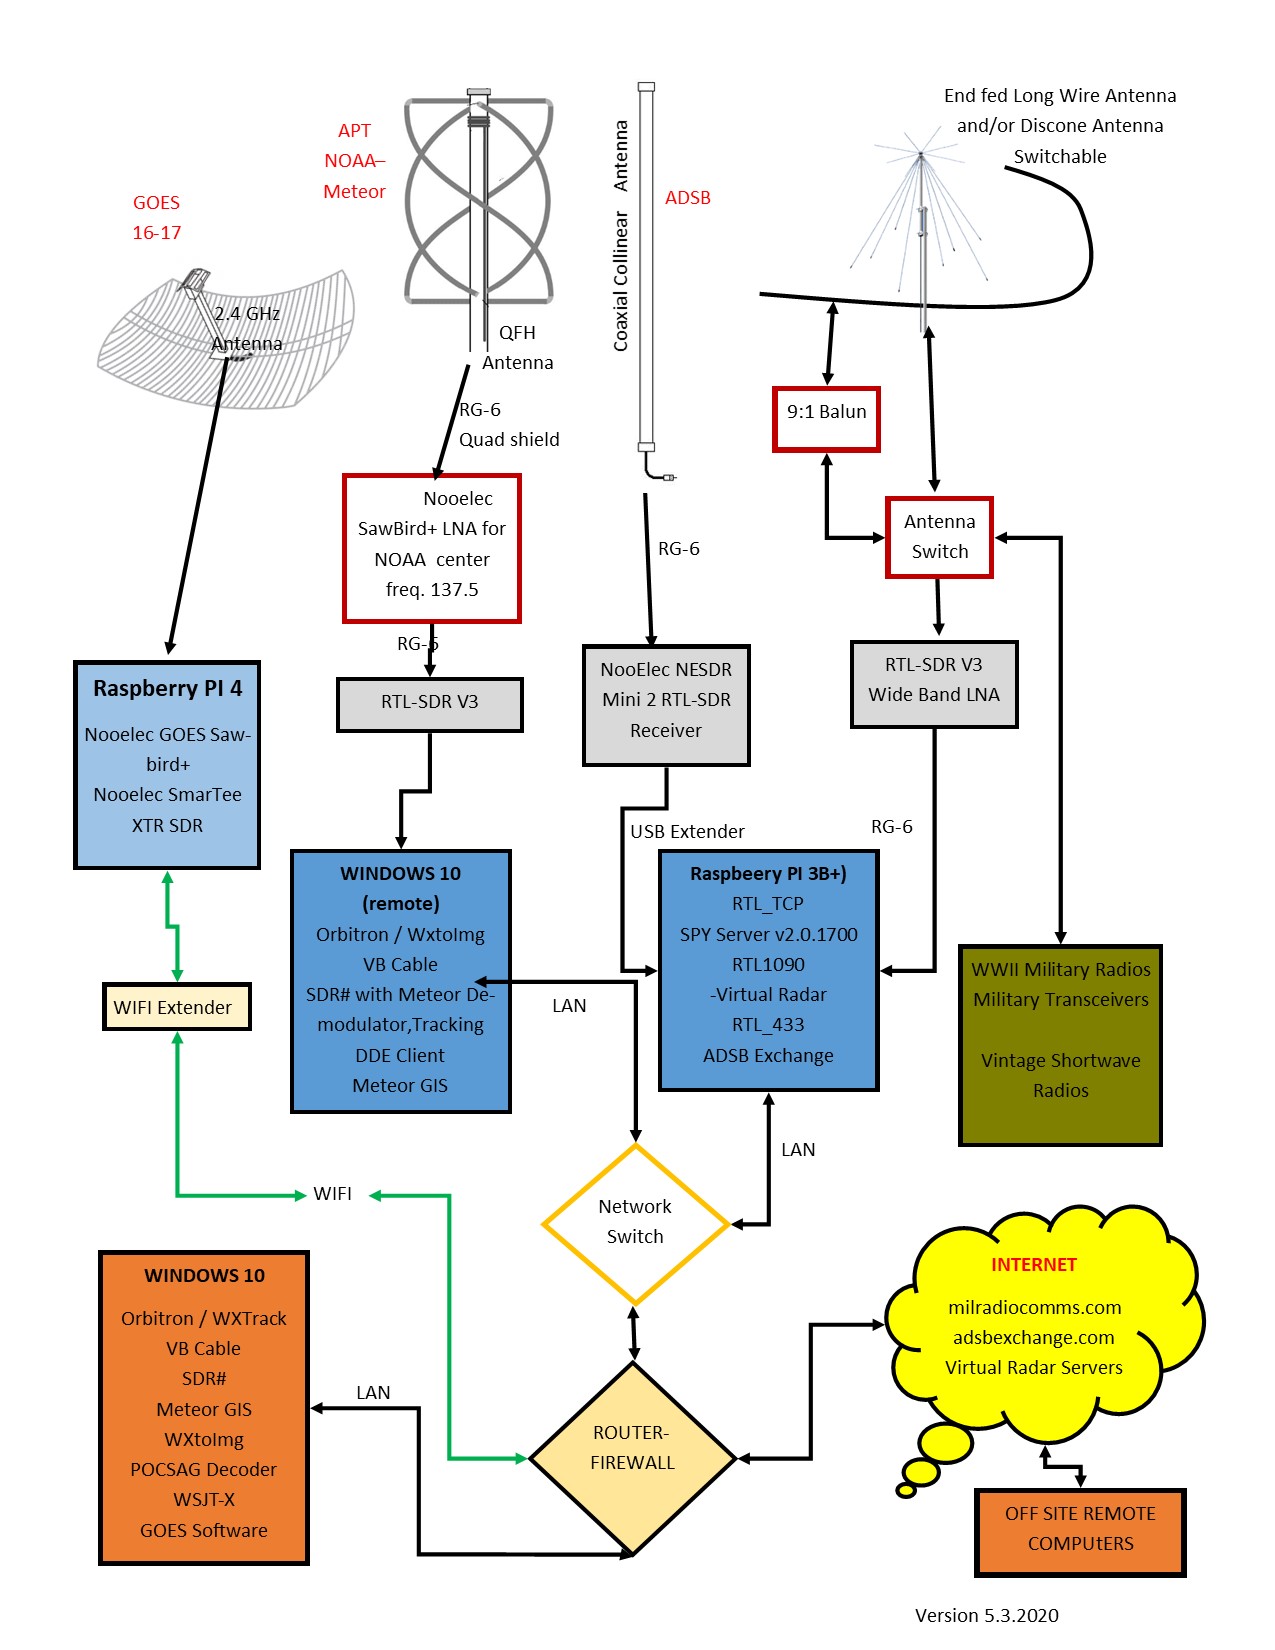
For APT and LRPT Imagery hardware, I use a Nooelec SmarteeXTR dongle and/or a RTL-SDR Blog V3 dongle. (Note the RTL-SDR Blog site is overflowing with useful information). I also use a Nooelec Sawbird+ LNA for NOAA APT (LNA Low Noise Amplifier, in this case, tuned to 137 Mhz). See my system diagram here.
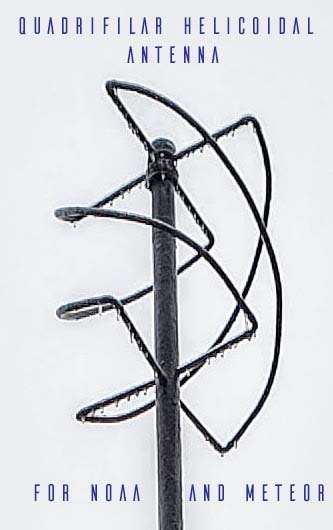
For an antenna, I have found that this antenna, which is called a QFH (Quadrifilar Helix Antenna) antenna, which you can build yourself with plumbing parts, is suitable and works great. Why such a bizarre-looking construct? Here is a simple explanation- Antennas perform best when they are properly polarized, or the antennas are pointed in the same direction in three-dimensional space. When you have a satellite orbiting the earth, even if the antenna is pointed straight down, its polarization to you on earth will change as it goes from horizon to horizon. The solution is to build an antenna that is properly polarized in all directions, hence the QFH antenna. Since the QFH antenna is stationary, Oribtron sends commands to SDR# and adjusts the frequency of the receiver to adjust for the doppler shift, as the selected satellite whizzes past at about 17,000 MPH (27358 KPH).
How to build a QFH Antenna
I have a build sheet PDF here It originally came from the Tinhat Ranch site, and I have modified it with the original author’s permission. I use commonly available RG6 Quad shield cable for the antenna to RTL-SDR.
My QFH Antenna built from the plans above.


I use the Following FREE Software: (all links open in a new tab)
- Track Satellites and Control SDR# with Orbitron
- Orbitron is a software designed for both satellite tracking and SDR# control. It allows you to:
- Track Satellites: Visualize the real-time or simulated positions of satellites as they orbit Earth.
- Control SDR# During Passes: Orbitron can automate tasks in SDR# software when a satellite is within range (during a pass). This involves triggering recordings or adjusting settings for optimal reception.
- Orbitron software available here: Orbitron
- Orbitron is a software designed for both satellite tracking and SDR# control. It allows you to:
- WxtoImg – For decoding and generating imagery from NOAA APT satellites (All NOAA APT pic start out as B/W, WxtoImg generates the false colors. It is available here: WxtoImg
- MeteorGIS – MeteorGIS is an outstanding free program for georeferencing images transmitted by the Russian weather satellite Meteor M 2-3 It is available here: MeteorGIS
- Low Rate Picture Decoder for decoding Meteor Imagery It is available here (this is a direct zip download) LRPT Decoder V 59 https://usradioguy.com/software/LRPT_Decoder_v59.zip NEW VERSION
- Satdump Satdump is a multi tool for satellite work, works very well and can decode many Satellites
- SDR# – SDR Sharp, the de facto standard free SDR# software for signal acquisition, analysis, and demodulation. It is available here: SDR# (Note: there are many SDR software out there.)
I also utilize the following plugins necessary to track and demodulate the signals received by SDR# - Meteor Demodulator Plugin v2.3
- DDE Tracking Client v1.2
- VB-Cable: A Virtual Audio Bridge
- VB-Cable acts as a virtual audio device, essentially creating a digital cable within your computer. Any audio sent to the CABLE input is seamlessly forwarded to the CABLE output. This makes it ideal for situations where you need to route audio between applications that don’t normally interact directly.
- For example, VB-Cable can be used to pipe the audio signal from SDR# (a software-defined radio program) to WxtoImg (an image processing application).
- It can be downloaded here: VBCable
- Smooth Meteor – for color correcting and rectifying (correcting shape) of Meteor Imagery. It is available here: Smooth Meteor
- LRPT Image Processor – another Meteor image processor It is available here: LRPT Image Processor
- MeteorGIS 2.24 MeteorGIS is a free program for referencing images send by the Russian weather satellite Meteor M No. 2-3 More info at bottom of this page as well. MeteorGIS official page
- I also use an image processor to help colorize and add my particular label to generated images, I use Photoshop Elements, but others will work if needed.
So what do these programs do?
Orbitron tracks the satellites, and when the one that is in your parameters appears, it sends a signal to DDE Tracker to start SDR# and runs the commands that you configure within SDR#. If it is a NOAA bird the audio received in the signal is piped via VBcable to WXtoImg where it is converted into an image(s).
If the satellite is Meteor, then the Meteor Demodulator takes the OQSPK signal from the Meteor Satellite signal and demodulates it from the signal stream, this is then sent via TCP within your computer to MeteorGIS, which, when there is data to decode, opens up the LRPT (Low Rate Picture Transmission) Decoder which takes the data streamed to it over TCP and line by line builds a picture out of whatever channels the Meteor is sending (and yes it does change from time to time). This Picture is then transferred to MeteorGIS where it combines the channels into several formats depending on your configuration. The GIS part then overlays the ‘picture’ onto a ‘map’ with different data like precipitation, false color, etc. One thing it should generate is a “treated” image which you can then manipulate separately with a program like Smoothmeteor.
GUIDES There are many, many, many helpful guides out there:
- Guide for setting up Weather Decoding Rev 2020 Written by Graham of the Facebook page Weather Satellite Image Group, I HIGHLY recommend following this guide!! WINDOWS/RTL based APT POLAR Weather Satellite station
- NOAA APT Decoding Here is a basic guide to getting started with NOAA APT imagery. Receiving NOAA Satellite Images
- Meteor M2-3 Decoding Heres is my goto site: Courtesy of HappySat – Guide to Setup Meteor M-N2/N2-2 with LRPT-Decoder and MeteorGis
- MeteorGIS 2.24 Command-Line Options A list of the options within MeteorGIS that can be run from a command line or Batch file. MeteorGIS 2.24 Command Line options.
GROUPS
You may feel slightly or totally OVERWHELMED when trying to set up and dial in your system. Don’t fret, there are some great online groups I would definitely encourage you to join.
- Weather Satellite Imagery Facebook Group – A must join group, it’s the group that helped me get started and they have a mentoring program.
- APT Group on Facebook
- The Amateur Satellite subreddit over on Reddit
WxtoImg Documentation
Some useful documents and tools for using the WXtoImg Software (compiled from the original WXtoImg site and re-edited).
- Comparison of enhancements
- WXtoImg reference manual in PDF format (includes GUI Interface manual, FAQ, and Required Calibration) (39 pages, 141k)
- WXtoImg command line interface manual in PDF format (32 pages, 217k)
- Example of a RAW audio file from NOAA 15 that WxtoImg can decode. It was taken 1/1/2020 over North America. You can click to listen, or save as to experiment with.
Use the imagery to predict the weather
Now that you are receiving weather satellites, such as NOAA 118,19, METEOR-M, and the like. Take the next step and use them like a meteorologist! Have a look at his site by Jacopo Cassinis
https://www.a-centauri.com/articoli/weather-predictions-from-satellite-data and take a look at all his other information as well!
HELPFUL HINTS
Here are some helpful hints that I have found useful.
- Backup your config and bat files, ESPECIALLY when upgrading software packages to a new or beta version.
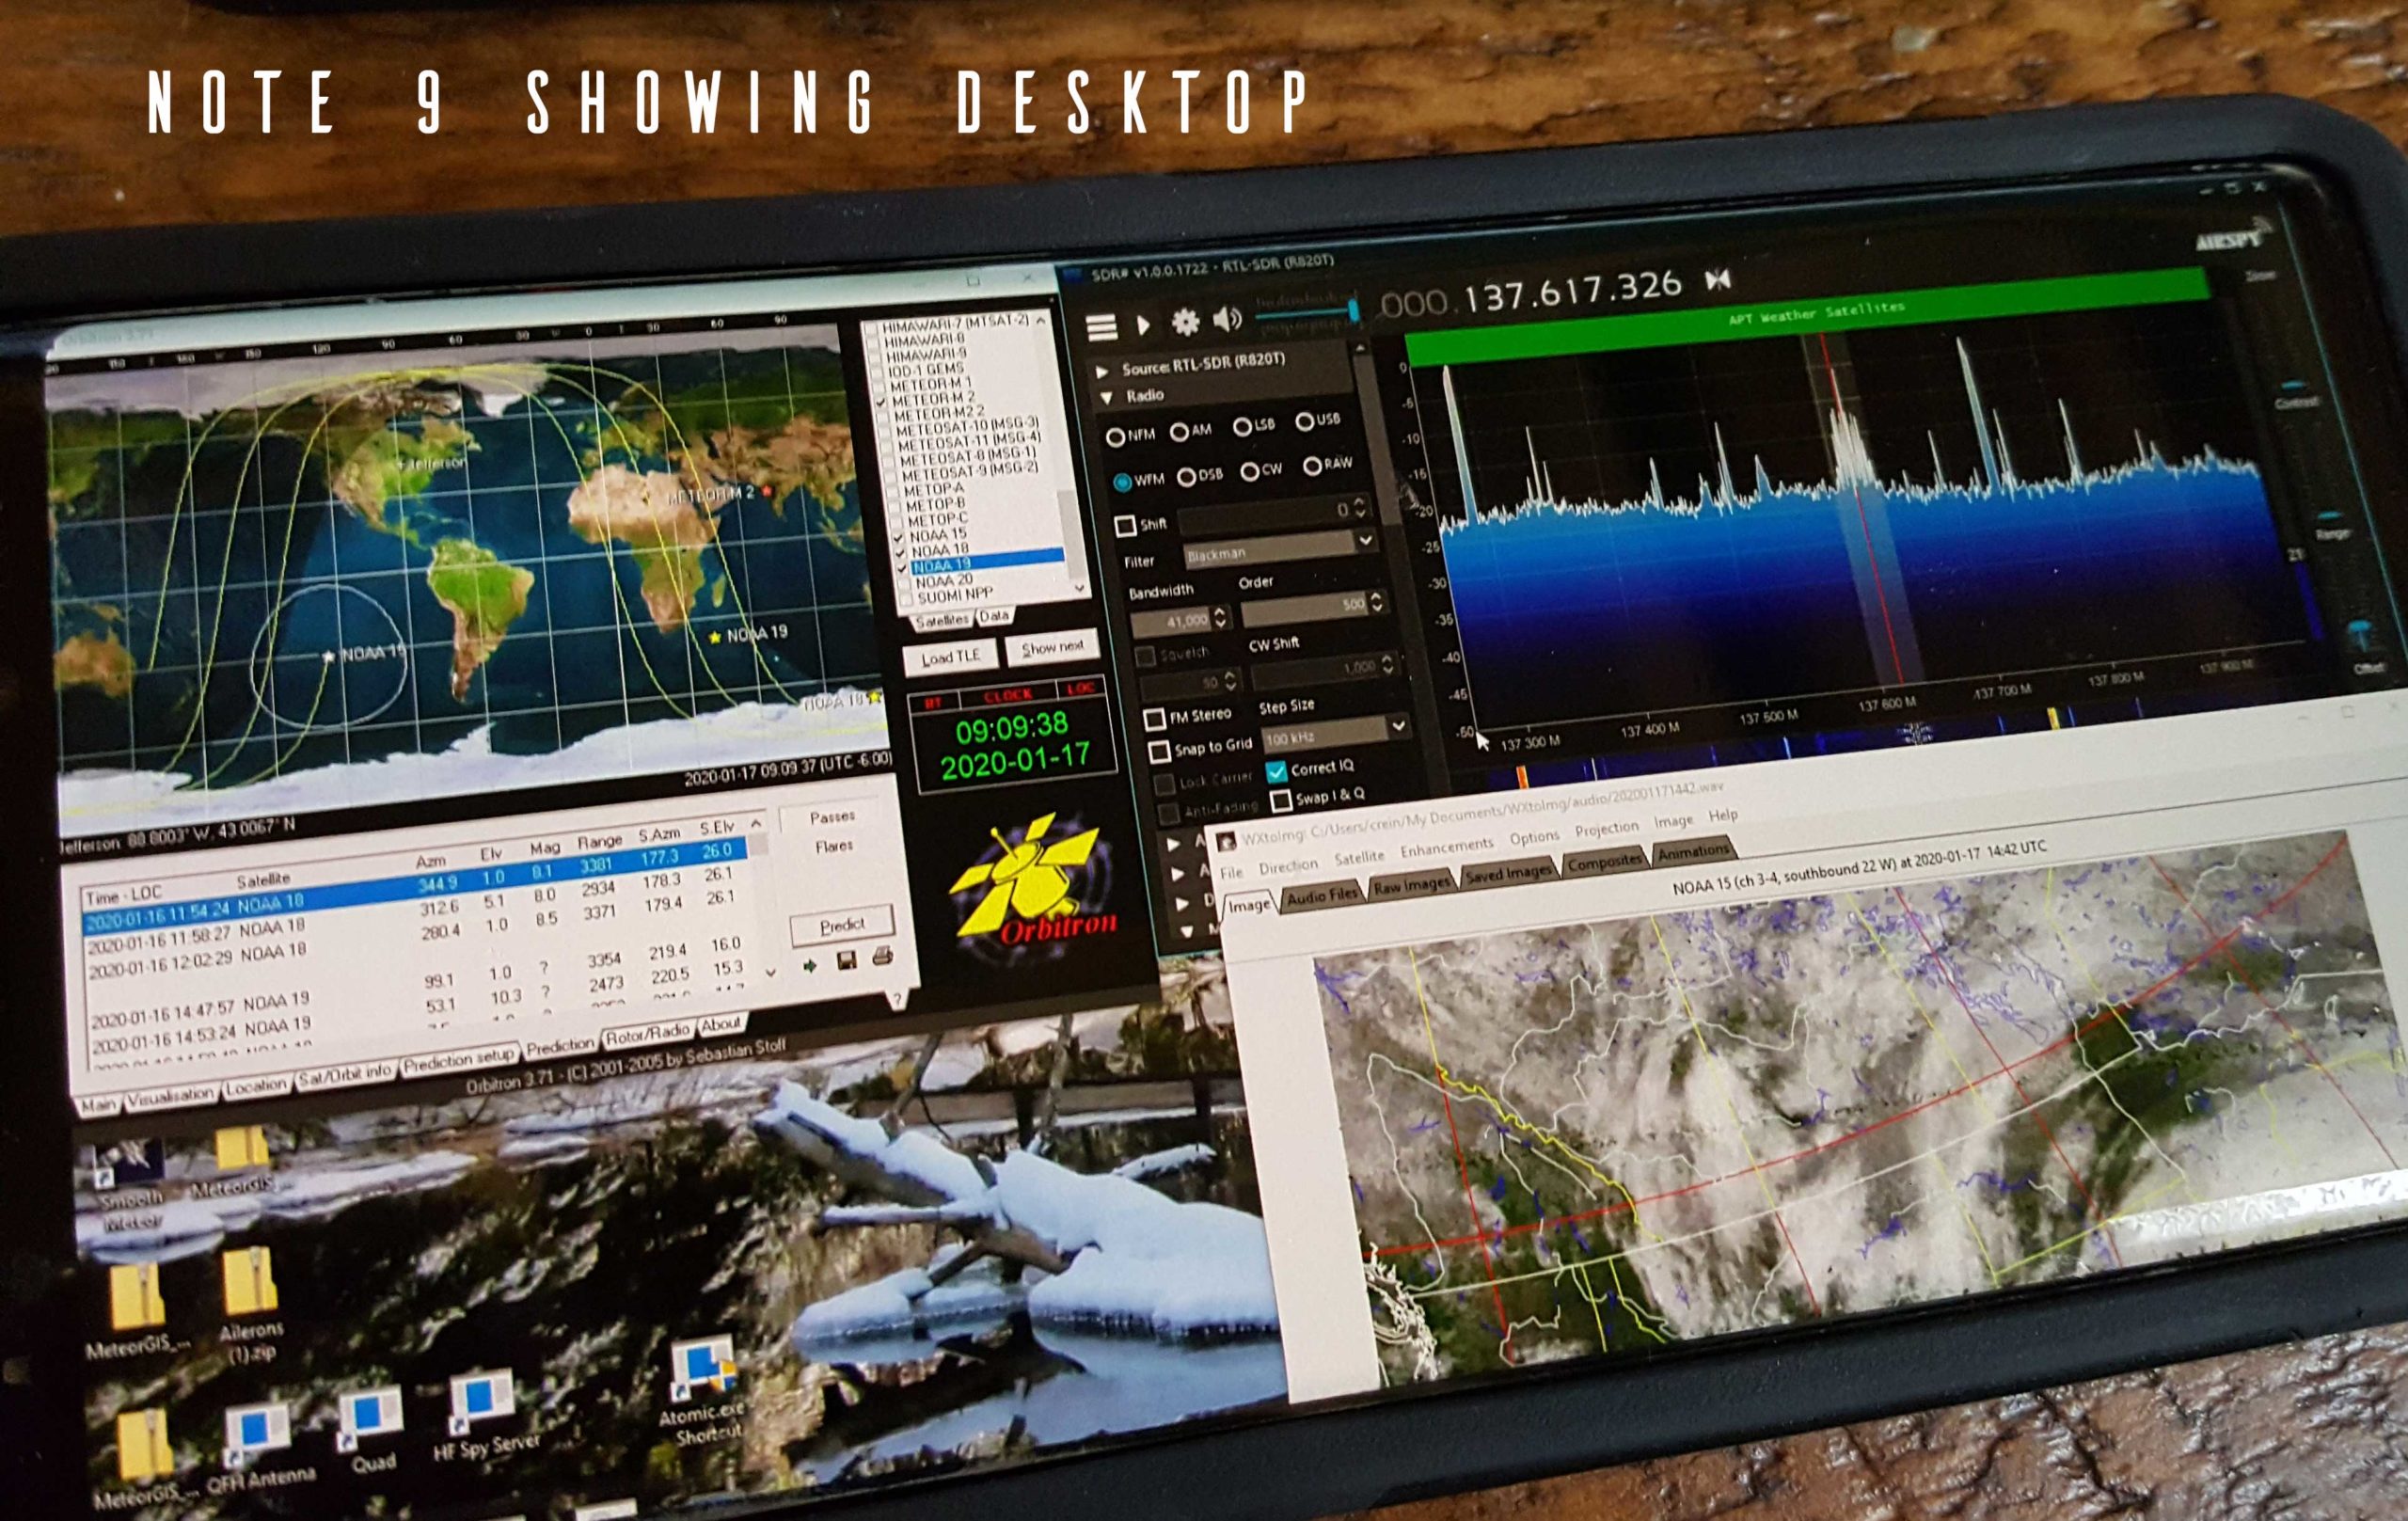
I added my WxtoImg, Orbitron, and SDR# to my Windows Startup directory, that way if the system crashes, or reboots, the software will load and continue to run automatically. Synch your PC time frequently, or get some software that will do it automatically. If you look elsewhere on my other sites, such as my Radio Restoration Page you’ll see my radio room is pretty cramped. It’s also on the second floor of my house. I have all my RTL-SDR radios and computers up there. BUT I rarely even go up there. I have found that for me, using Google Remote Desktop is just the ticket. I can run all my computers on the second floor, remotely from my comfortable office and computer on the first floor. I can also run any of them from my Note 9 Smartphone with the Google Remote app!
Sometimes the satellites break or fight each other…
UPDATE 1/23/2023 Unfortunately it appears that Meteor M2 permanently failed on 24 December 2022. Problems with the Meteor M2 satellite losing orientation stability have occurred several times in the past, and have always been fixed within a few days after the event. This does not appear to be the case now.
Yes, not everything works all the time, and satellites break and die. Sometimes part of the satellite breaks and the other parts keep chugging away (Meteor Mn2-2 Got hit with a micrometeorite knocking APT out completely, and causing major issues with the rest of the systems) Here is a link to check the status of Polar Operational Environmental Satellites (POES) spacecraft status POES Operational Status – POES Status – OSPO.
As for fighting, it kind of is true. Space is big, but not that big, and satellites very frequently overlap each other. Just when you think you’re going to get a nice pass of NOAA 19, Meteor M2 (on the same frequency) can be overhead as well and hijack your signal! Or all four sats might be over your location at the same time (within a few thousand miles of each other). Watch your passes in Orbitron and at least once a month you’ll see some issue of timing and overlap.
My SDR# and WxtoImg Settings
NOTE: These work for me on my system, to capture both NOAA satellites and Meteor Satellites, You may have need of different settings.
| SDR# Settings | WXtoImg Settings |
| SDR# Settings Sampling Mode – Quadrature Sampling Device Sampling Rate – 0.90001 MSPS Decimation – noneRadio – WFM Bandwidth – 41,000 Order – 500 Correct IQ is checked ✔ I do not use any filters or Noise reduction plugins Example of Tracking DDE Client plugin Settings for NOAA_18 AOS radio_Start radio_modulation_type<wfm> radio_frequency_Hz<137912500> You would, of course, need to change this for the respective satellite radio_bandwidth_Hz<41000> radio_tracking_frequency_On LOS radio_Stop | There are many options- this is what I have checked:Under Options: I have these checked ✔ ✔ Disable auto-decode ✔ Crop Telemetry ✔ ResynchSensor Illumination – VIS Noise Filter – 5×5 Gausian Medium Despeckle – 2.0 Contrast – Hist Eq Illumination Compensation – None Gamma – 1.4 Sharpen – 0.6Under Projection: ✔ NormalUnder Satellite: ✔Autodetect APTUnder Direction: ✔Autodetect |
World Clock
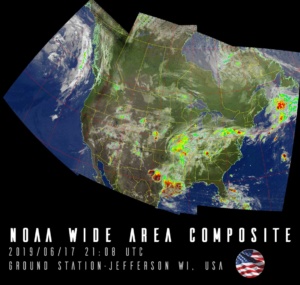
Building Wide Area Composites with WXtoImg
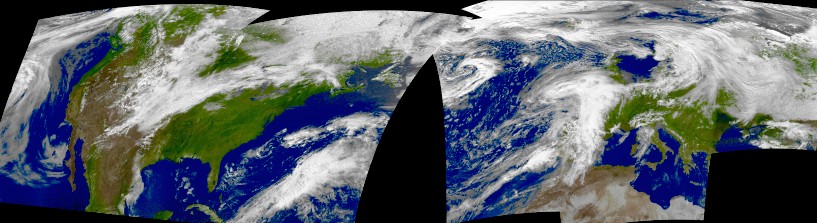
Thanks to Jeff Kelly (New Jersey, US), Mike Kimzey (Philadelphia, US), David Kunz (San Francisco, US), Cornelius Danielsen (Norway), Alan Hinton (UK), Michael Sørensen (Denmark), and Hans-Juergen Luethje (Germany) who provided the pristine images on their websites to create this wide-area Multi-Spectral Analysis image.WXtoImg has the ability to combine images from multiple ground stations into very wide-area composite images. With images from enough ground stations, it would be possible to produce an image that covered the globe. Pristine images, available on many websites, and raw images can be downloaded and processed by WXtoImg almost identically to locally recorded images. By obtaining pristine or raw images from other WXtoImg sites, it is possible to create composite images that cover a much wider area than a single ground station could cover.
- You’ll need a registered version of WXtoImg, and version 2.10.6 or later to perform this task.
- NOTE: Be sure your TLE’s are current, and your computer time is synched!
- Firstly, in Options -> Projection Options you’ll need to set the following:
- Reference Latitude: in general, should be set to a latitude that is within the north and south boundaries below
- Reference Longitude: this must be set to a longitude within the west and east boundaries below (use something near the middle if in doubt)
- North Boundary (latitude): The northern latitude limit of the projection (use negative numbers for degrees south)
- South Boundary (latitude): The southern latitude limit of the projection (use negative numbers for degrees south)
- West Boundary (longitude): The western longitude limit of the projection (use negative numbers for degrees west)
- East Boundary (longitude): The eastern longitude limit of the projection (use negative numbers for degrees west)
- Scale: Images can get very large, using a scale of about 1.0 will preserve most of the detail, but using a scale of 0.8 or 0.5 or even 0.25 is not unreasonable, alternatively you can set the width of the desired image in pixels (e.g. 1024)
- Select Options -> Save Options. Note that these projection boundaries won’t affect WXtoImg’s production of composite images during auto processing.
- Set Projection to Eckert IV or Eckert VI or Mercator. Some projections like Orthographic produce very curved and distorted images when the composite image gets very wide.
- It is a good idea to set Contrast to none or Linear (constant) and Illumination Compensation to Full so that the images will blend together nicely.
- Set Enhancement to whatever you like (except Pristine).
- Now build the wide-area composite image by opening pristine (or raw images) using File -> Open Raw Image. (You can also open your own audio files for this step.) A large image will be created, mostly black.
- Choose File -> Composite image to… and save this. It is preferable to use a PNG extension if you plan to put together more than about 8 images. Using a ..JPG extension is less desirable because JPEG images are lossy and the loss increases each time you add an image.
- Repeat steps 6 and 7, compositing the image to the same file you chose the first time you performed step 7. Note that you will be prompted if you want to replace the image, choose OK, it won’t replace your composite image, just merge the new image into it.
- To view your composite image, select File -> View Image and select the file you created (or look in the Composites tab).
- You can increase the contrast in the final image (you’ll likely want to do this if you selected none for Contrast in step 4), by selecting Histogram to equalize Image from the Image menu (and saving the resulting image.) Alternatively, you could select Increase Contrast from the Image menu several times.
SITES WITH PRISTINE IMAGES
Updated 01-04-2023 (Please note that these sites are operated by individuals and may be running or down, or offline for repairs or upgrades.)
If you are interested in sharing your WXtoImg website, send me the link and I will post it here – email to creinemann@gmail.com
Pristine images may be downloaded and processed by WXtoImg nearly identically to locally made recordings. Using multiple sites, they can be used to generate wide-area composite images as shown above. To process a pristine image, simply download the full-size image and open using (File -> Open Raw Image) in WXtoImg.
Contact me to have your site included.
Additional Worldwide Satellite Image links updated 01-04-2023
Other Satellite Capture Pages: These currently do not show “Pristine” Images needed for a wide area capture, but are great sites as well.
Sites that have not had ANY updated images within the past year, or have since been deactivated have been removed.
| North America | Central & South America | Europe | Africa/Indian Ocean | Asia | Australia/Pacific |
|---|---|---|---|---|---|
| Tobaccoville, NC,USA | Oxstedt, Germany | ||||
| Sebastopol, California | Grootegast, Netherland | ||||
| Cassis, France | |||||
| Lodi, Italy | |||||
| Bosany, Slovakia |
Meteor Satellites
The Meteor-M N2-3 (Launched on June 27, 2023)and Meteor-M N2-4 are polar-orbiting Russian weather satellites , like its’ predecessors M2 and M2-2. Their main missions are weather forecasting, climate change monitoring, seawater monitoring/forecasting, and space weather analysis/prediction.
Meteor M2 has been silent on APT since mid-December 24, 2022, as of 1/09/2023 it still has not been recovered, even though ground controllers have tried 11 times since the first of the year Unfortunately it appears that Meteor M2 has permanently failed on 24 December 2022. Problems with the Meteor M2 satellite losing orientation stability have occurred several times in the past, and have always been fixed within a few days after the event.
Meteor M N2-2 (Launched on July 5, 2019 -Unfortunately Meteor M2-2 suffered a possible collision in orbit on 12/18/2019, and as of this writing looks to be permanently offline for LRPT APT – HRPT receiving is still available but requires a different setup)
Meteor-M No. 2-3 and M2-4 transmit images using the digital LRPT protocol at or 137.1 MHz or137.9MHz (That Frequency can Change!!) and can be received with an SDR and proper antenna such as a v dipole or QFH
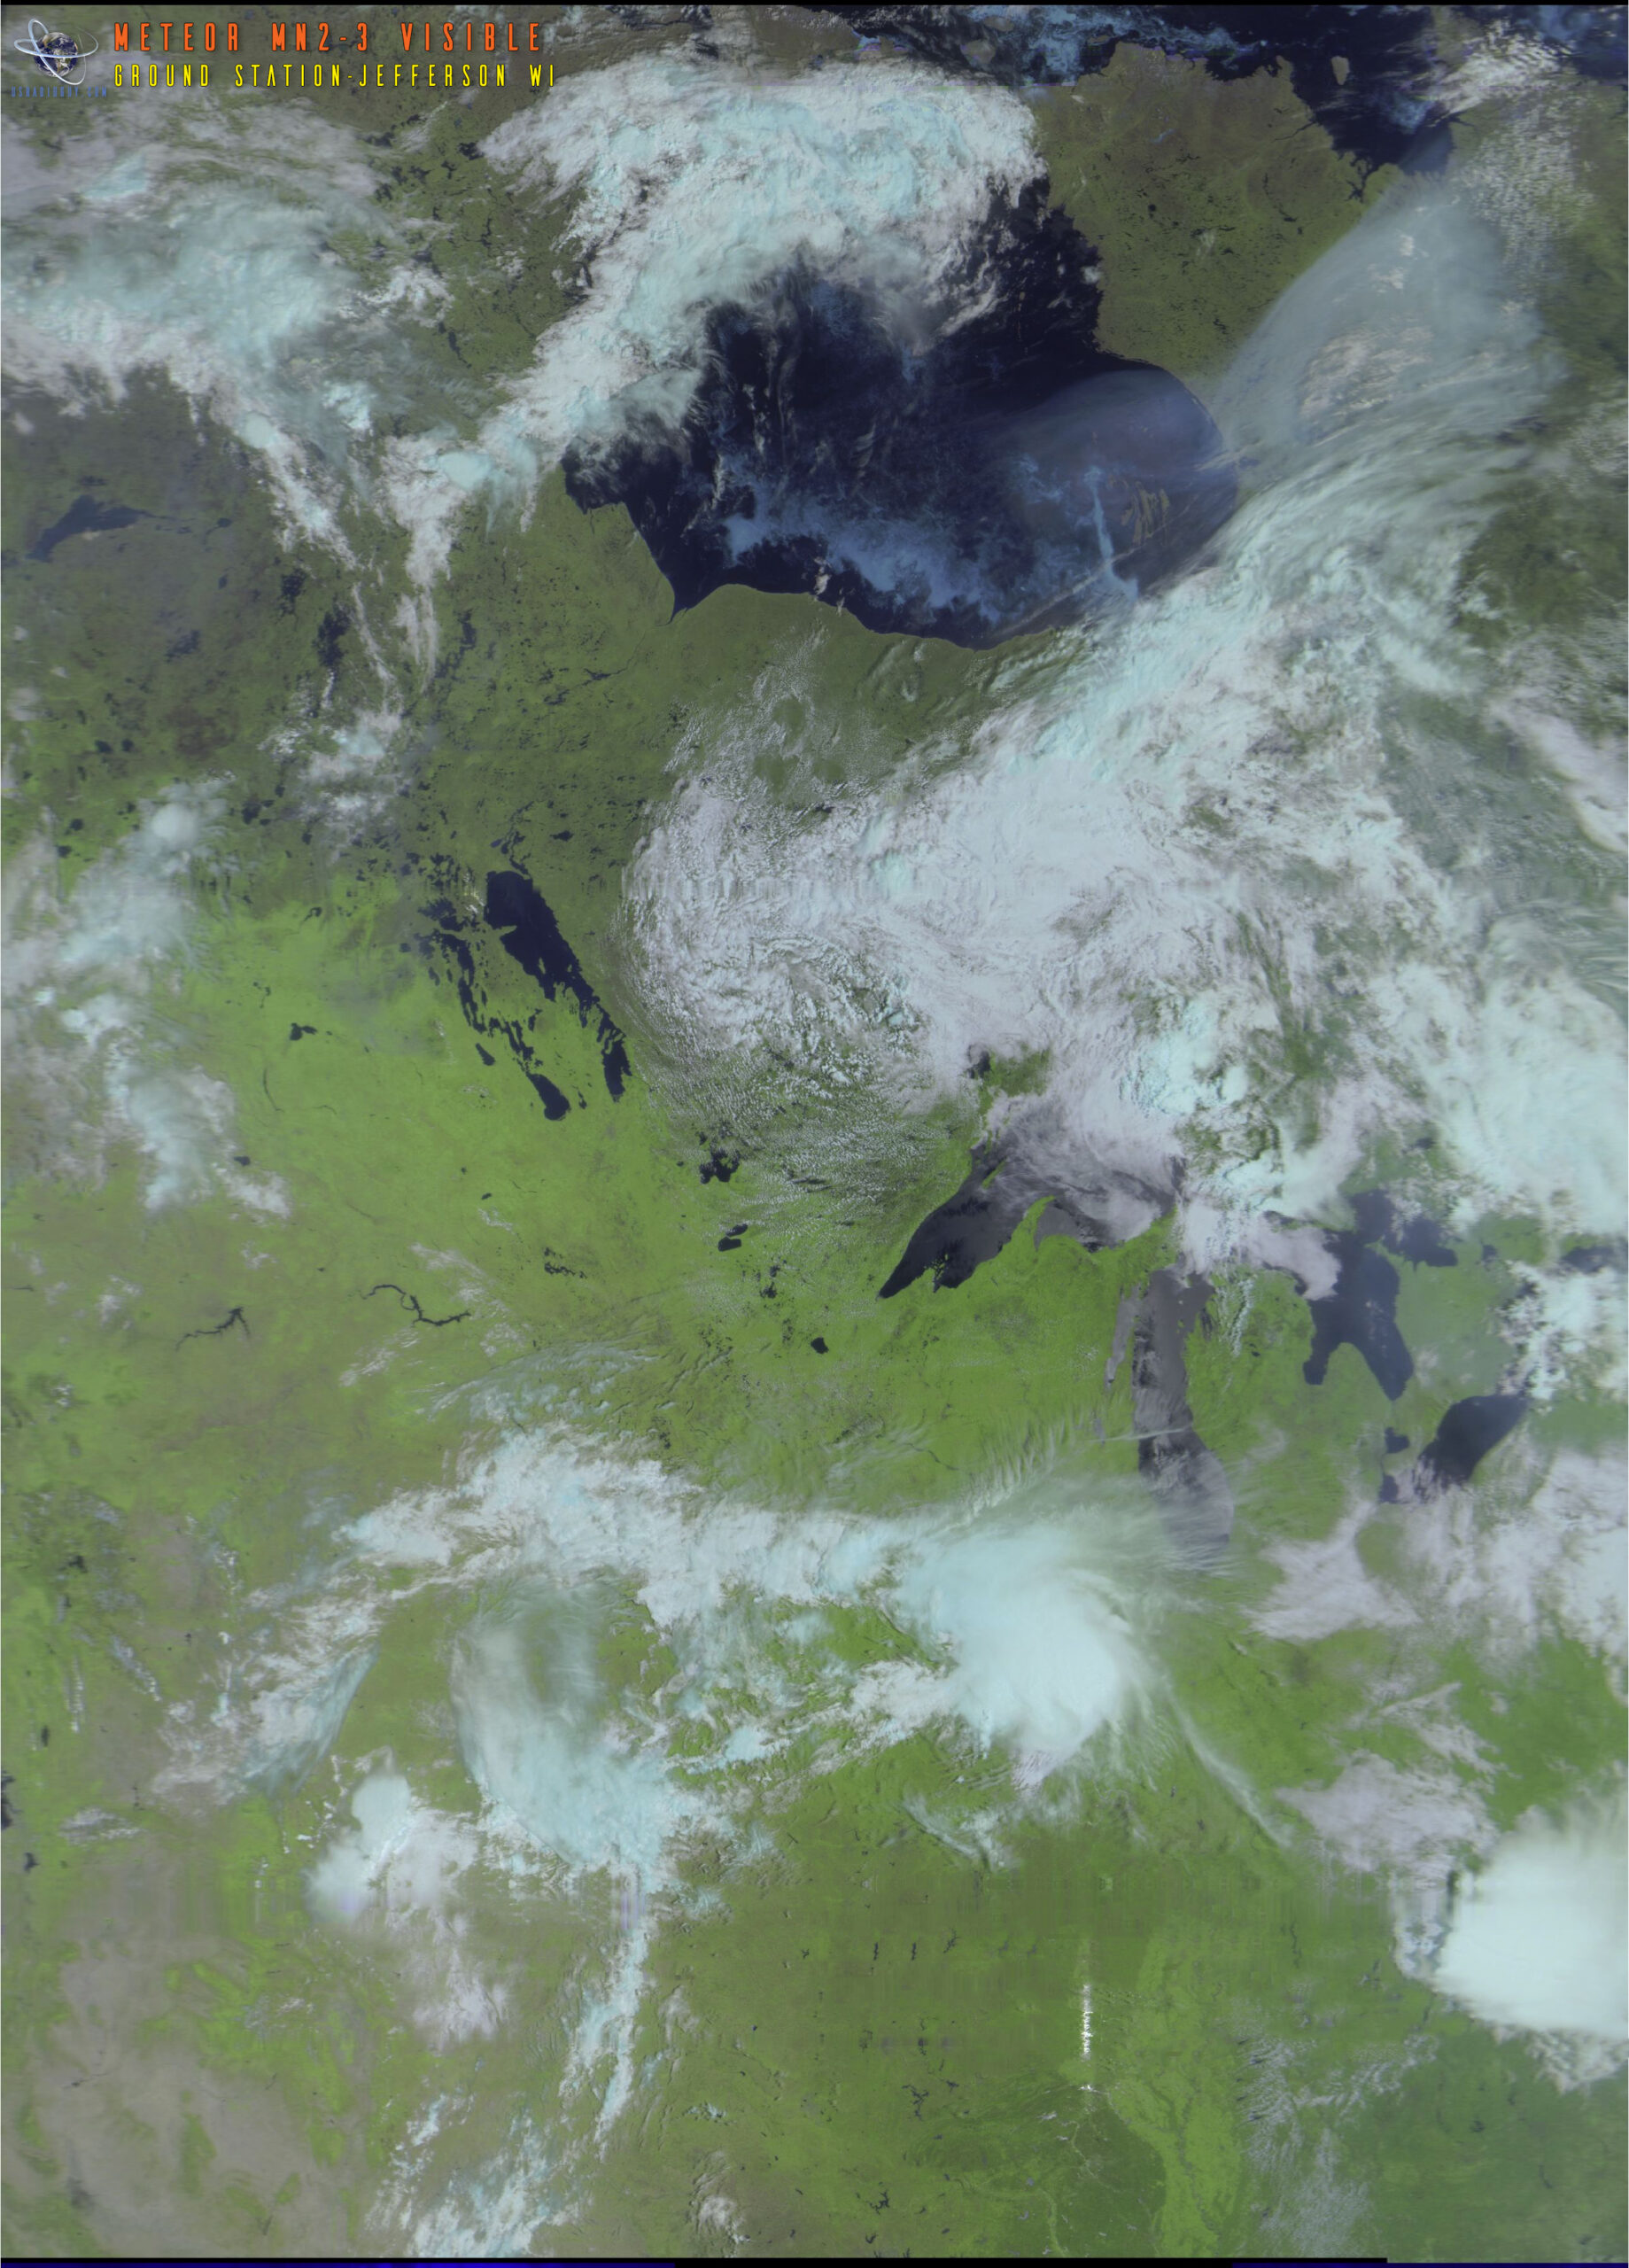
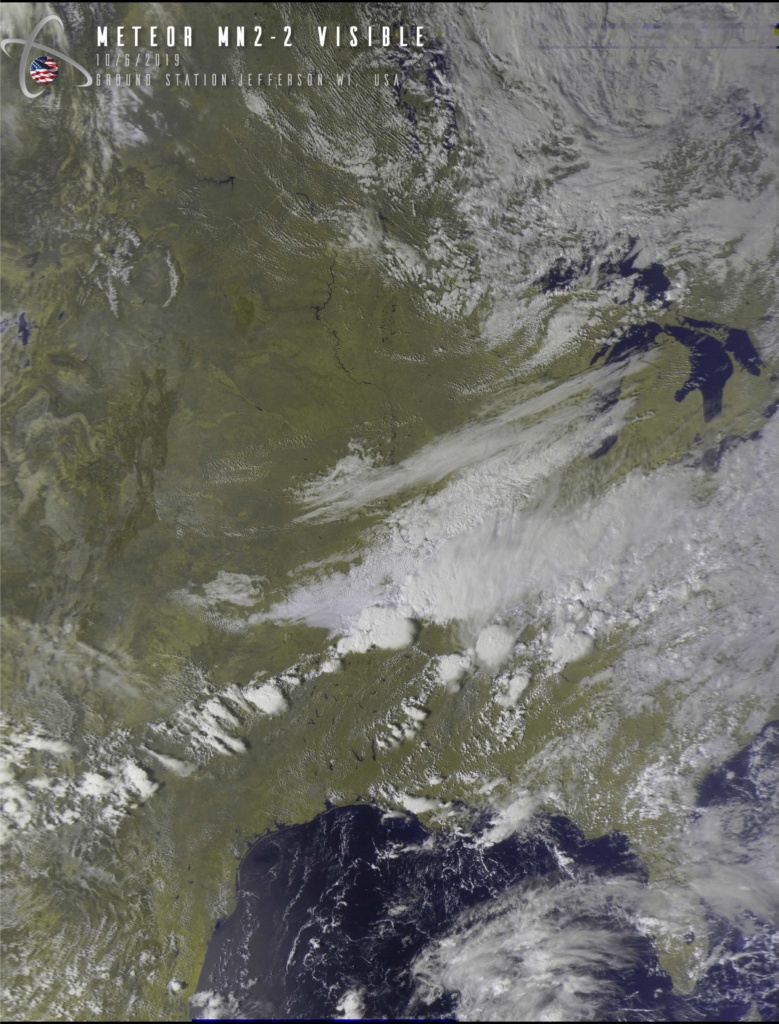
Example of one of my Meteor Captures:
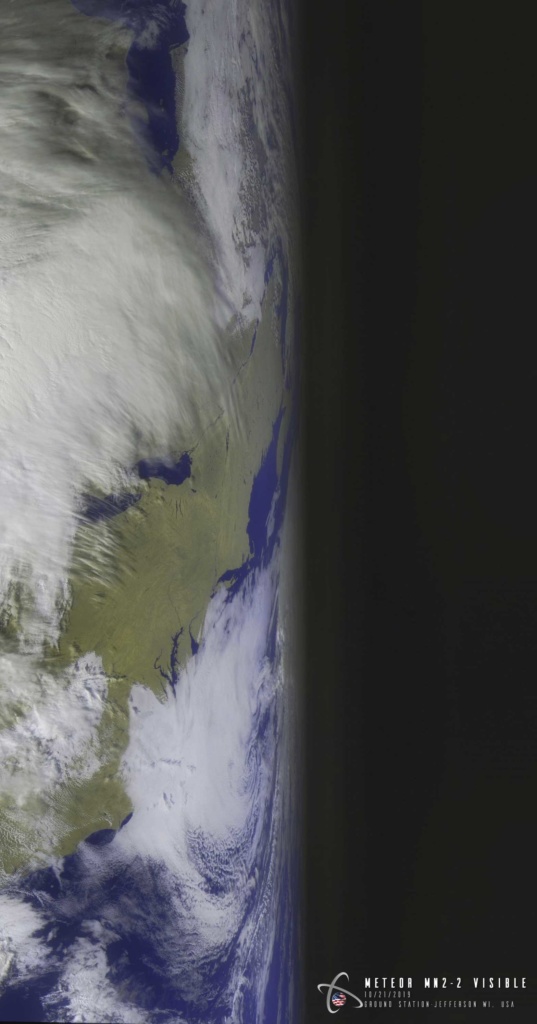
Click the image then expand the pop-up by clicking the small “enlarge” box in the upper right corner to see it in full resolution!
Meteor Links of use.
- MeteorGIS.space MeteorGIS is a free program for referencing images sent by the Russian weather satellite Meteor MN-2.
- Meteor M2-3 and M2-4 Decoding Guides
- MeteorGIS 2.24 Command-Line Options A list of the options within MeteorGIS that can be run from a command line or Batch file. MeteorGIS 2.24 Command Line options.
- RadioFouine.net – Downloads
- Meteor-M N2-3 Satellite Operational Status
- Using Satdump to Decode Meteor
METEOR RF communications: Use of LRIT (Low Rate Information Transmission) and HRIT (High Rate Information Transmission) communication standards according to WMO (World Meteorological Organization) to permit data exchange on an international level.
| 1 | X-band data transmission | 8025-8400 MHz |
| Nominal carrier frequency | 8192 (T1); 8320 (T2) MHz | |
| Data transmission rate | 15.36, 30.72, 61.44, or 122.88 Mbit/s (on each channel) | |
| Transmitter output power | 10 W | |
| Data modulation type | RFM, DRFM (Digital Radio Frequency Memory) | |
| 2 | L-band data transmission | 1.69 – 1.71 GHz |
| Nominal carrier frequency | 1.7 GHz | |
| Data transmission rate | 665.4 kbit/s (HRPT transmission) | |
| Transmitter output power | 5 W | |
| Modulation type | PSK (Phase-Shift Keying) | |
| 3 | VHF-band data transmission | 137-138 MHz (MSU-MR bands in LRPT format) |
| Data transmission rate | 80 kbit/s (LRPT transmission) | |
| 4 | Onboard data collection and transmission system from DCPs (Data Collection Platforms) | |
| No of DCPs in visibility zone, common | 150, < 500 | |
| Message volume | 250 bit | |
| Data transmission rate | 1200 or 400 bit/s | |
| Location accuracy of DCP | 3.6 km (for one session) | |
| Total volume of stored data for one orbital revolution | 300 kByte | |
| Data reception frequency from DCPs | 401.2-402.0 MHz (UHF band) | |
| Data transmission from S/C to ground | 1690-1710 MHz (L-band) |
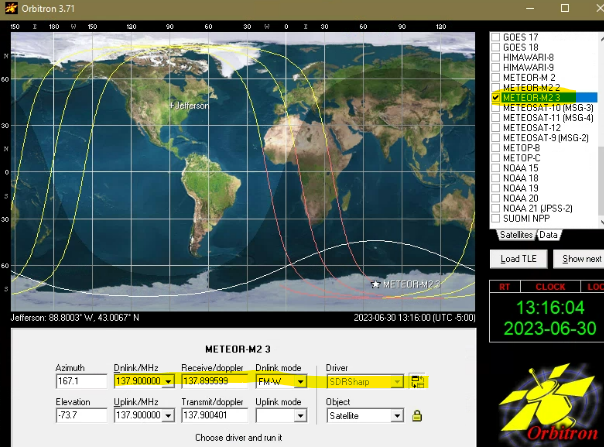
Meteor 2-3 LRPT using SDR# DDE Tracking Client v1.2, MeteorGIS 2.25, Orbitron, and LRPT Decoder settings.
This is what I am using if it can help anyone.
Orbitron– Using the current weather.txt – Select METEOR-M2 3
In SDR# with DDE Tracking Client v1.2 under config I use these settings:
Example of Tracking DDE Client plugin Settings for Meteor-M2_3
AOS
radio_Start
radio_modulation_type
radio_center_frequency_Hz<138380050>
radio_frequency_Hz<137900000>
radio_bandwidth_Hz<120000>
send_tracking_frequency_On
M2_decoder_init_Line
M2_decoder_init_Line
PSK_set_SymbolRate
OQPSK_demodulator_Start
start_programm_Path<C:\Meteor\MeteorGIS.bat> NOTE I use a batch file to run MeteorGIS2.24 you might use MeteorGIS.exe
LOS
OQPSK_demodulator_Stop
send_tracking_frequency_Off
radio_Stop
MeteorGIS 2.24
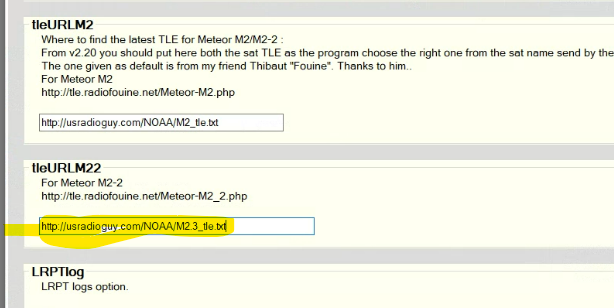
I use my server TLE file in the M2_LRPT Decoder section
https://usradioguy.com/NOAA/M2.3_tle.txt Note that the current version of MeteorGIS will save that file as M2.2_tle.txt in your LRPT_Decoder folder. Until both meteorGIS AND LRPT Decoder are updated this will work!
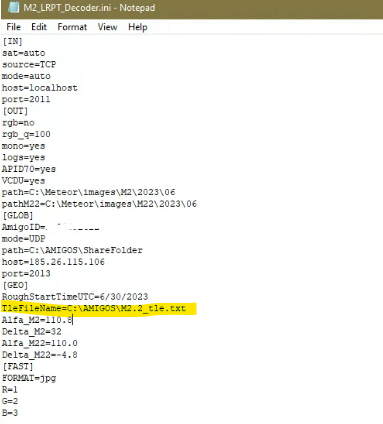
This is my ini file for LRPT_Decoder:
[IN]
sat=auto
source=TCP
mode=auto
host=localhost
port=2011
[OUT]
rgb=no
rgb_q=100
mono=yes
logs=yes
APID70=yes
VCDU=yes
path=C:\Meteor\images\M2\2023\06
pathM22=C:\Meteor\images\M22\2023\06
[GLOB]
AmigoID= _(Your unique number will appear here after the first connection to the server)
mode=UDP
path=C:\AMIGOS\ShareFolder
host=185.26.115.106
port=2013
[GEO]
RoughStartTimeUTC=6/30/2023
TleFileName=C:\AMIGOS\M2.2_tle.txt
Alfa_M2=110.8
Delta_M2=32
Alfa_M22=111.2
Delta_M22=-3.2
[FAST]
FORMAT=jpg
R=1
G=2
B=3
NEW as of 9/1/2021
I have published a method to layer into Meteor GIS MODIS Fire data to display fire locations globally into Meteor imagery. You can find the instructions here: https://usradioguy.com/layering-fire-and-hotspot-date-on-meteor-sat-imagery/
Other Weather Software options
If you made it this far down my page, I am guessing you’re kind of interested in this…so Here is one more cool thing to try, even if you don’t use any SDR’s or receivers.
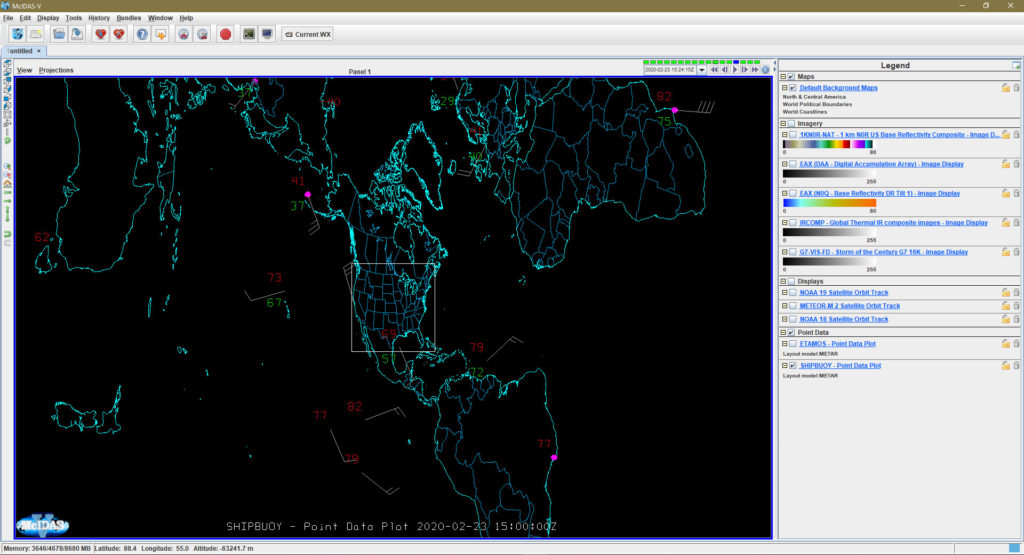
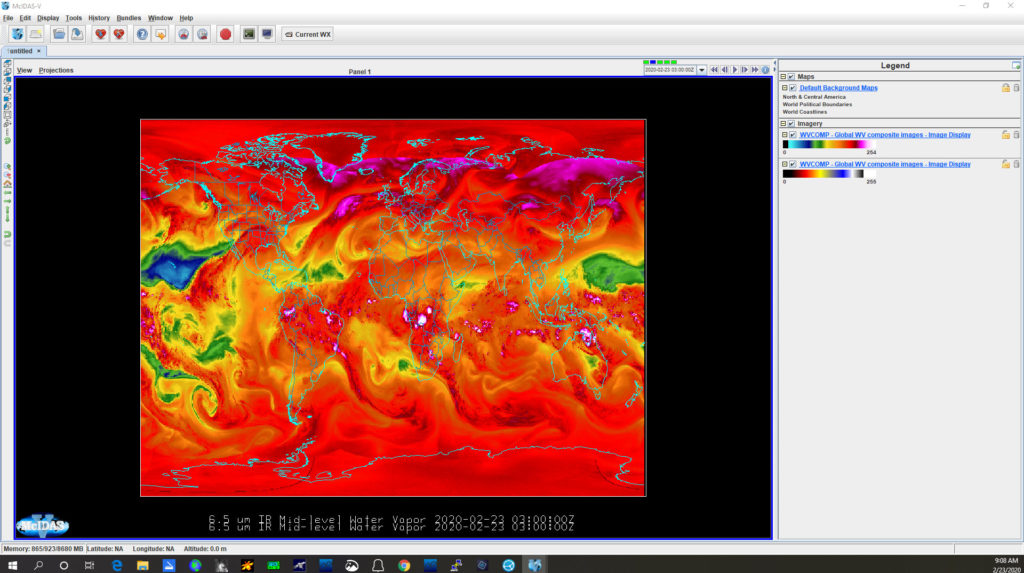
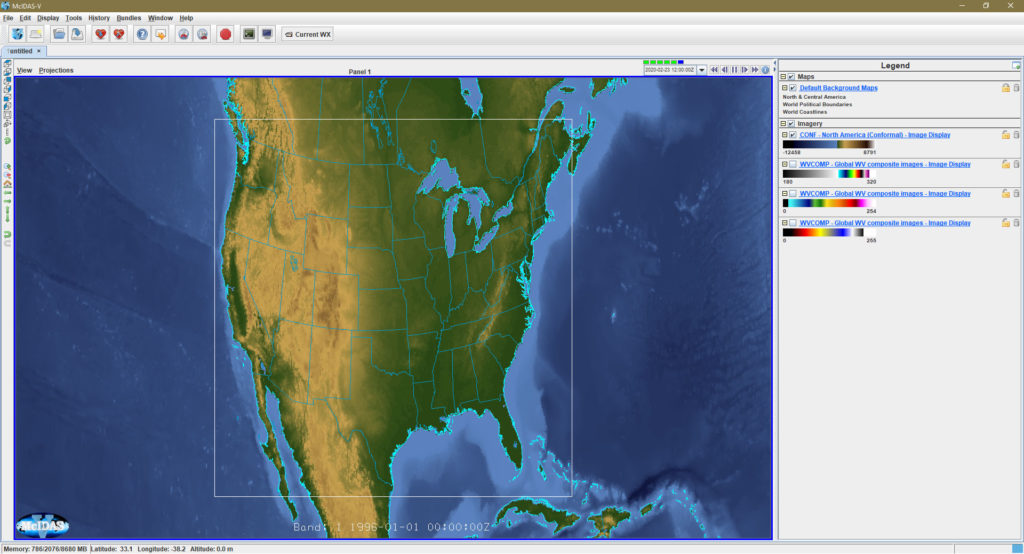
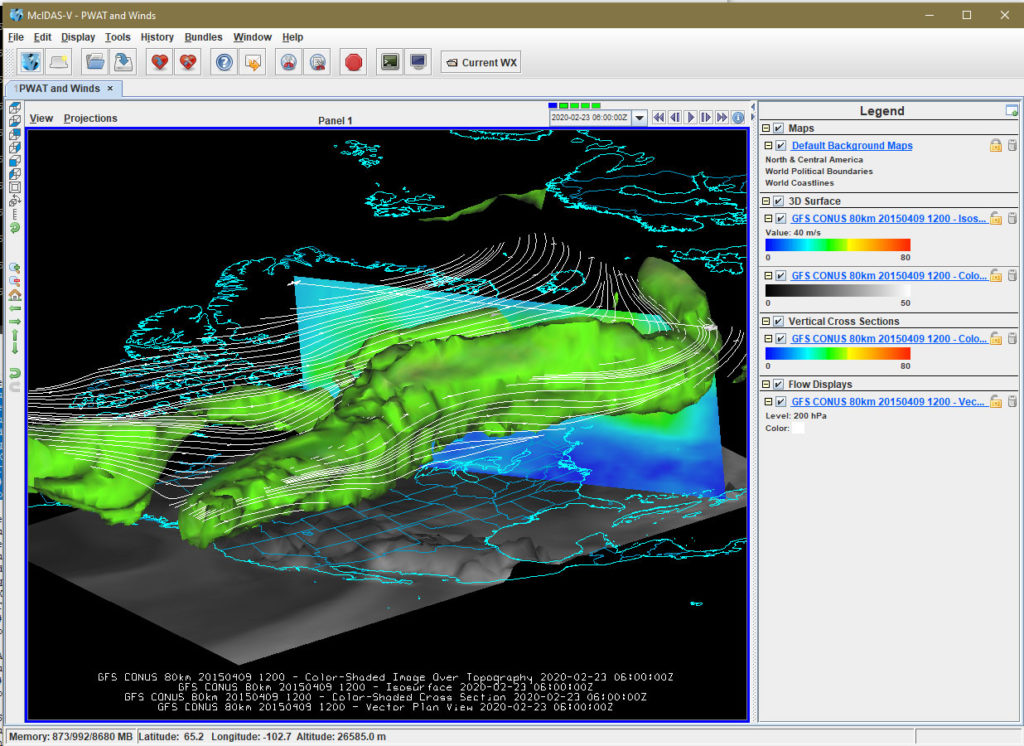
I tried some new (to me) open-source software to try out from the Space Science and Engineering Center a the University of Wisconsin-Madison. It’s called McIDAS-V (Man Computer Interactive Data Access System). It has some high-level capabilities, I’ve been using it for a few weeks now, trying out the hundreds of options and modeling of weather you can do.
The software is VERY CPU intensive and graphics card intensive, so DO NOT try and run it if you are running other software like WxtoImg or LRPT or MeteorGIS.
You can do 3D modeling of winds, weather, etc. I have some screen captures of this below, It also allows for animated loops of just about everything you see posted, I just did not copy my loops. Ther is a new version coming out called McIDAS-X -DO NOT download this version, it is not Open Source as of yet, and requires big $$$. My friend at SSEC says that the X version will be available in a year or so. There are three OS versions Windows, Mac and Linux. Read the system requirements to see if your computer can run it. (the 32 bit Java Runtime Environments (JRE) utilize a maximum of 1536 MB RAM, while 64 bit JREs can utilize ALL of the RAM available to the operating system (64 bit OS required).
I was able to import a NOAA 15 and A GOES image into it, but only as an image, there is a way to load up GOES raw data, but I haven’t done that as of yet. For those of you out there that can receive GOES GRB data, there is a slick GOES-R Series Ingestor package as well. I am still experimenting with it, but feel free to try it for yourself.
NOTE: while a lot of data can be had Globally. most if not all of the radar and ground information is U.S.A related. Ther are plenty of open-source software pieces available out there, for Europe and other areas as well.
I am NOT an expert on this. Please read the system requirement and the list of firewall port assignments for data as well! It seemed daunting, but great for experimenting!
https://www.ssec.wisc.edu/mcidas/software/v/
The following ports are used to access remote data, and must be open through any firewalls or proxies at your location:
21 – FTP
80 – WWW
112 – ADDE servers (imagery, radar, point, upper air and profiler data)
8080 – THREDDS data servers
Here are some samples of what I did with this software.