Stray Light Zone (SLZ)
![]()
Stray Light Zone, or “who took a chunk out of my image?”
Updated 03.19.2025
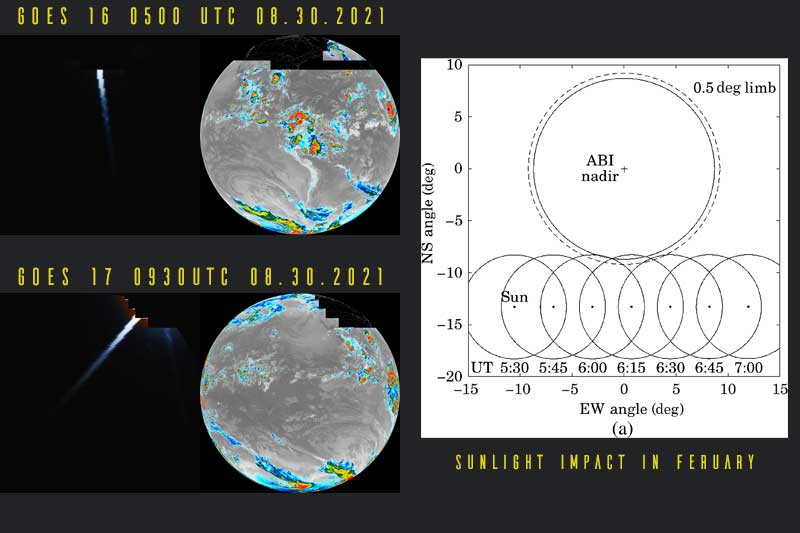
If you are seeing strange images around 05:00 -09:30 UTC, depending on the orbital position and satellite, like the ones below, don’t immediately run to check all your settings and connections!!
The term “stray light” generally refers to unwanted light that interferes with the intended operation of an optical system. However, when you see “Stray Light Zone (SLZ)” it is most often referring to a phenomenon that occurs with GOES (Geostationary Operational Environmental Satellite) weather satellites.
It can happen around satellite local midnight time, and the ABI would see a direct head-on view of the sun near the edge of the earth. This could damage the ABI imager (in the same way as your eye’s retina or camera sensor could be damaged) so steps are taken to prevent this from happening while preserving as much of the rest of the image as possible.
GOES satellites (as well as Himawari 8 and 9, GK2A, etc.) encounter two periods during the year in which they are in Earth’s shadow. Known as the Eclipse (ECL) season, these periods require the spacecraft to be completely dependent upon batteries for a maximum of 72 minutes daily. Eclipses occur approximately from late February to mid-April, and from late August to mid-October.
Since GOES is in a geosynchronous orbit, the sun will yearly traverse a +/- 23.5 degree angle perpendicular to the Earth’s equator (GOES orbit plane). As a result, near the Vernal and Autumnal Equinoxes, the Earth disk will periodically occult the sun, from a GOES perspective. Essentially, there are two eclipse seasons for each GOES spacecraft. Each eclipse season spans a 48-day period, symmetric around the equinox and the sun occultation lasts for a maximum of 72 minutes/day during the equinox.
During eclipse season with the GOES-R satellite series, this Stray Light Zone (SLZ) contamination is visible approximately 45 minutes before and after satellite local midnight (~0500 UTC for GOES-East and ~0900 UTC for GOES-West) each day for approximately 45 days before and after the vernal and autumnal equinox, in the form of a vertical beam of light that is more intense at the end closer to the Sun. Stray light contamination is often prominent in the images of visible and near-infrared bands (bands 1–6), although it can also be discerned in band 7 images. This is a normal occurrence for the ABI.
But how? The underlying mechanism behind this occurrence hinges upon preemptive measures devised to avert direct solar irradiation upon the ABI detectors, and concurrently, to safeguard the optimal operational capacity of the ABI sensor. This is realized through a predetermined solar avoidance regimen orchestrated by analyzing a subset of the ABI swaths in correspondence with the geometric angle between the ABI instrument and solar azimuth during specific temporal intervals. The ABI scan mirrors are consequently adjusted to diverge from observations of the terrestrial scene during these defined periods. Furthermore, solar radiance can induce thermal elevation within the ABI instrument, thereby influencing its data acquisition precision by augmenting detector temperatures.
Furthermore, the ABI instrument undergoes routine calibration endeavors to warrant the veracity and dependability of its measurements. This calibration routine entails obtaining measurements from a stabilized reference target, thereby compensating for any sensor sensitivity alterations over time, including those attributable to solar radiation exposure.
A related optical artifact, denoted as Lens Flare (manifesting as a diminutive lightening bolt-shaped radiance), arises due to the phenomenon of light refraction upon transiting Earth’s atmosphere (the angular deviation of solar illumination through the atmospheric medium can reach magnitudes of up to 0.6°). This refraction effect occasionally enables residual solar illumination to impinge upon segments of the ABI imager.
In view of the distinct spectral absorption profiles of each band, a pragmatic equilibrium equation encompassing all bands is employed to optimize usable imagery across the spectrum. This regime will effectuate a “flip” towards the southern hemisphere in the month of February.
Additional Impacts
During the eclipse season with the GOES-R satellite series Geostationary Lightning Mapper (GLM), solar intrusion into the lens assembly will result in localized blooming (false events) and saturation (blind regions) in the data. These effects will occur daily around the same time as the ABI effects (0500 UTC and 0900 UTC). The daily effects begin with many false events at the limb, which cover regions of varying size and location as the eclipse features move across the field of view. The false events will peak during the beginning and end of the eclipse season and the 20-second files will intermittently peak in size above 3-5 MB per file during false events, which is well above the average of ~0.3 MB per file.
The increased number of false events can cause an overflow condition in the electronics which saturates the event processing. This saturation creates blind regions in the data outside of the areas impacted by the solar intrusion. The length of these temporary outages depends on the region and is on the order of minutes. A blooming filter is being developed to remove the event spikes, although lightning detection outages will remain in the affected regions.
There is a significant risk of light from the sun directly entering the scanners and causing degraded products as the spacecraft enters and leaves the Earth’s shadow, requiring a special algorithm to be applied to the Imager products. In some instances shifting, canceling, or truncating the frame is necessary. This is known as the “Stray Light Zone (SLZ).” The seasonal charts below describe the GOES-East and GOES-West Imager and Sounder scan frames that are canceled or shifted due to SLZ.
GOES Seasonal Eclipse Charts
Link to eclipse charts Charts compiled by NOAA/NESDIS
 Looking for hardware recommendations?? Have a look here at my Tried and Tested hardware – SDR’s, Pi’s, Connectors, Antenna’s, and more.