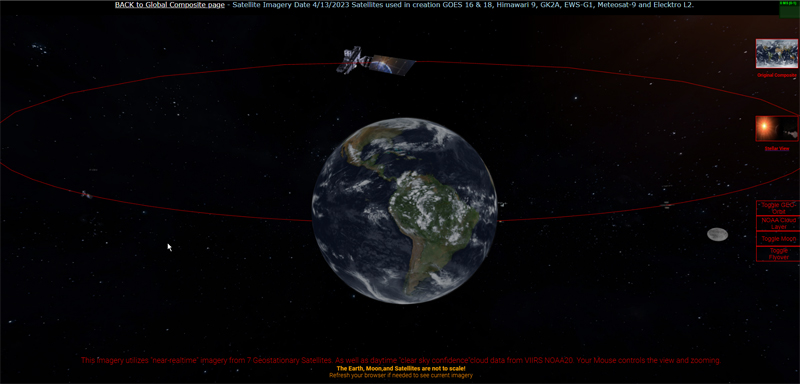
Daily 3D view of Earth
A Java Script application using Near Realtime Satellite Imagery to create a 3-dimensional view of the Earth in space.
I was thinking of a different way to display the daily planetwide imagery that I receive and create and thought I’d have another go at 3D modeling…
Three.js is a JavaScript library used for creating 3D graphics and animations on web pages. It is built on top of WebGL, which is a web standard for rendering 3D graphics in the browser and provides a higher-level API for working with 3D objects, cameras, lights, and materials.
Three.js allows developers to create interactive 3D experiences for the web, such as games, visualizations, and virtual environments. It includes a wide range of features, such as support for different types of 3D geometry, animation tools, physics engines, and post-processing effects.
I am using the daily global composite that I receive and create on a daily basis, as the source material for the creation of a 3D earth, as well as adding the moon, and several of the geostationary satellites in the corresponding longitudinal positions (example: GOES-16 at 75.2W).
For fun, I did add one notable starship I have orbiting the Earth as well…(hint. it’s using impulse engines, not warp drive.)
Here is the link to the Near – Real Time Planet-wide Geo Ring Rendering:
NOTE, I highly reccomend that you use hardware acceleration when available on your browser, this is enabled usually by default, on older systems you may experience loading issues or lag as I am using higher than standard HRIT derived imagery. If you want the details, this is how the process works:
Via My Ground Station:
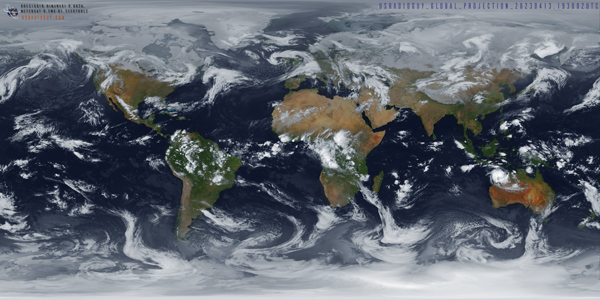
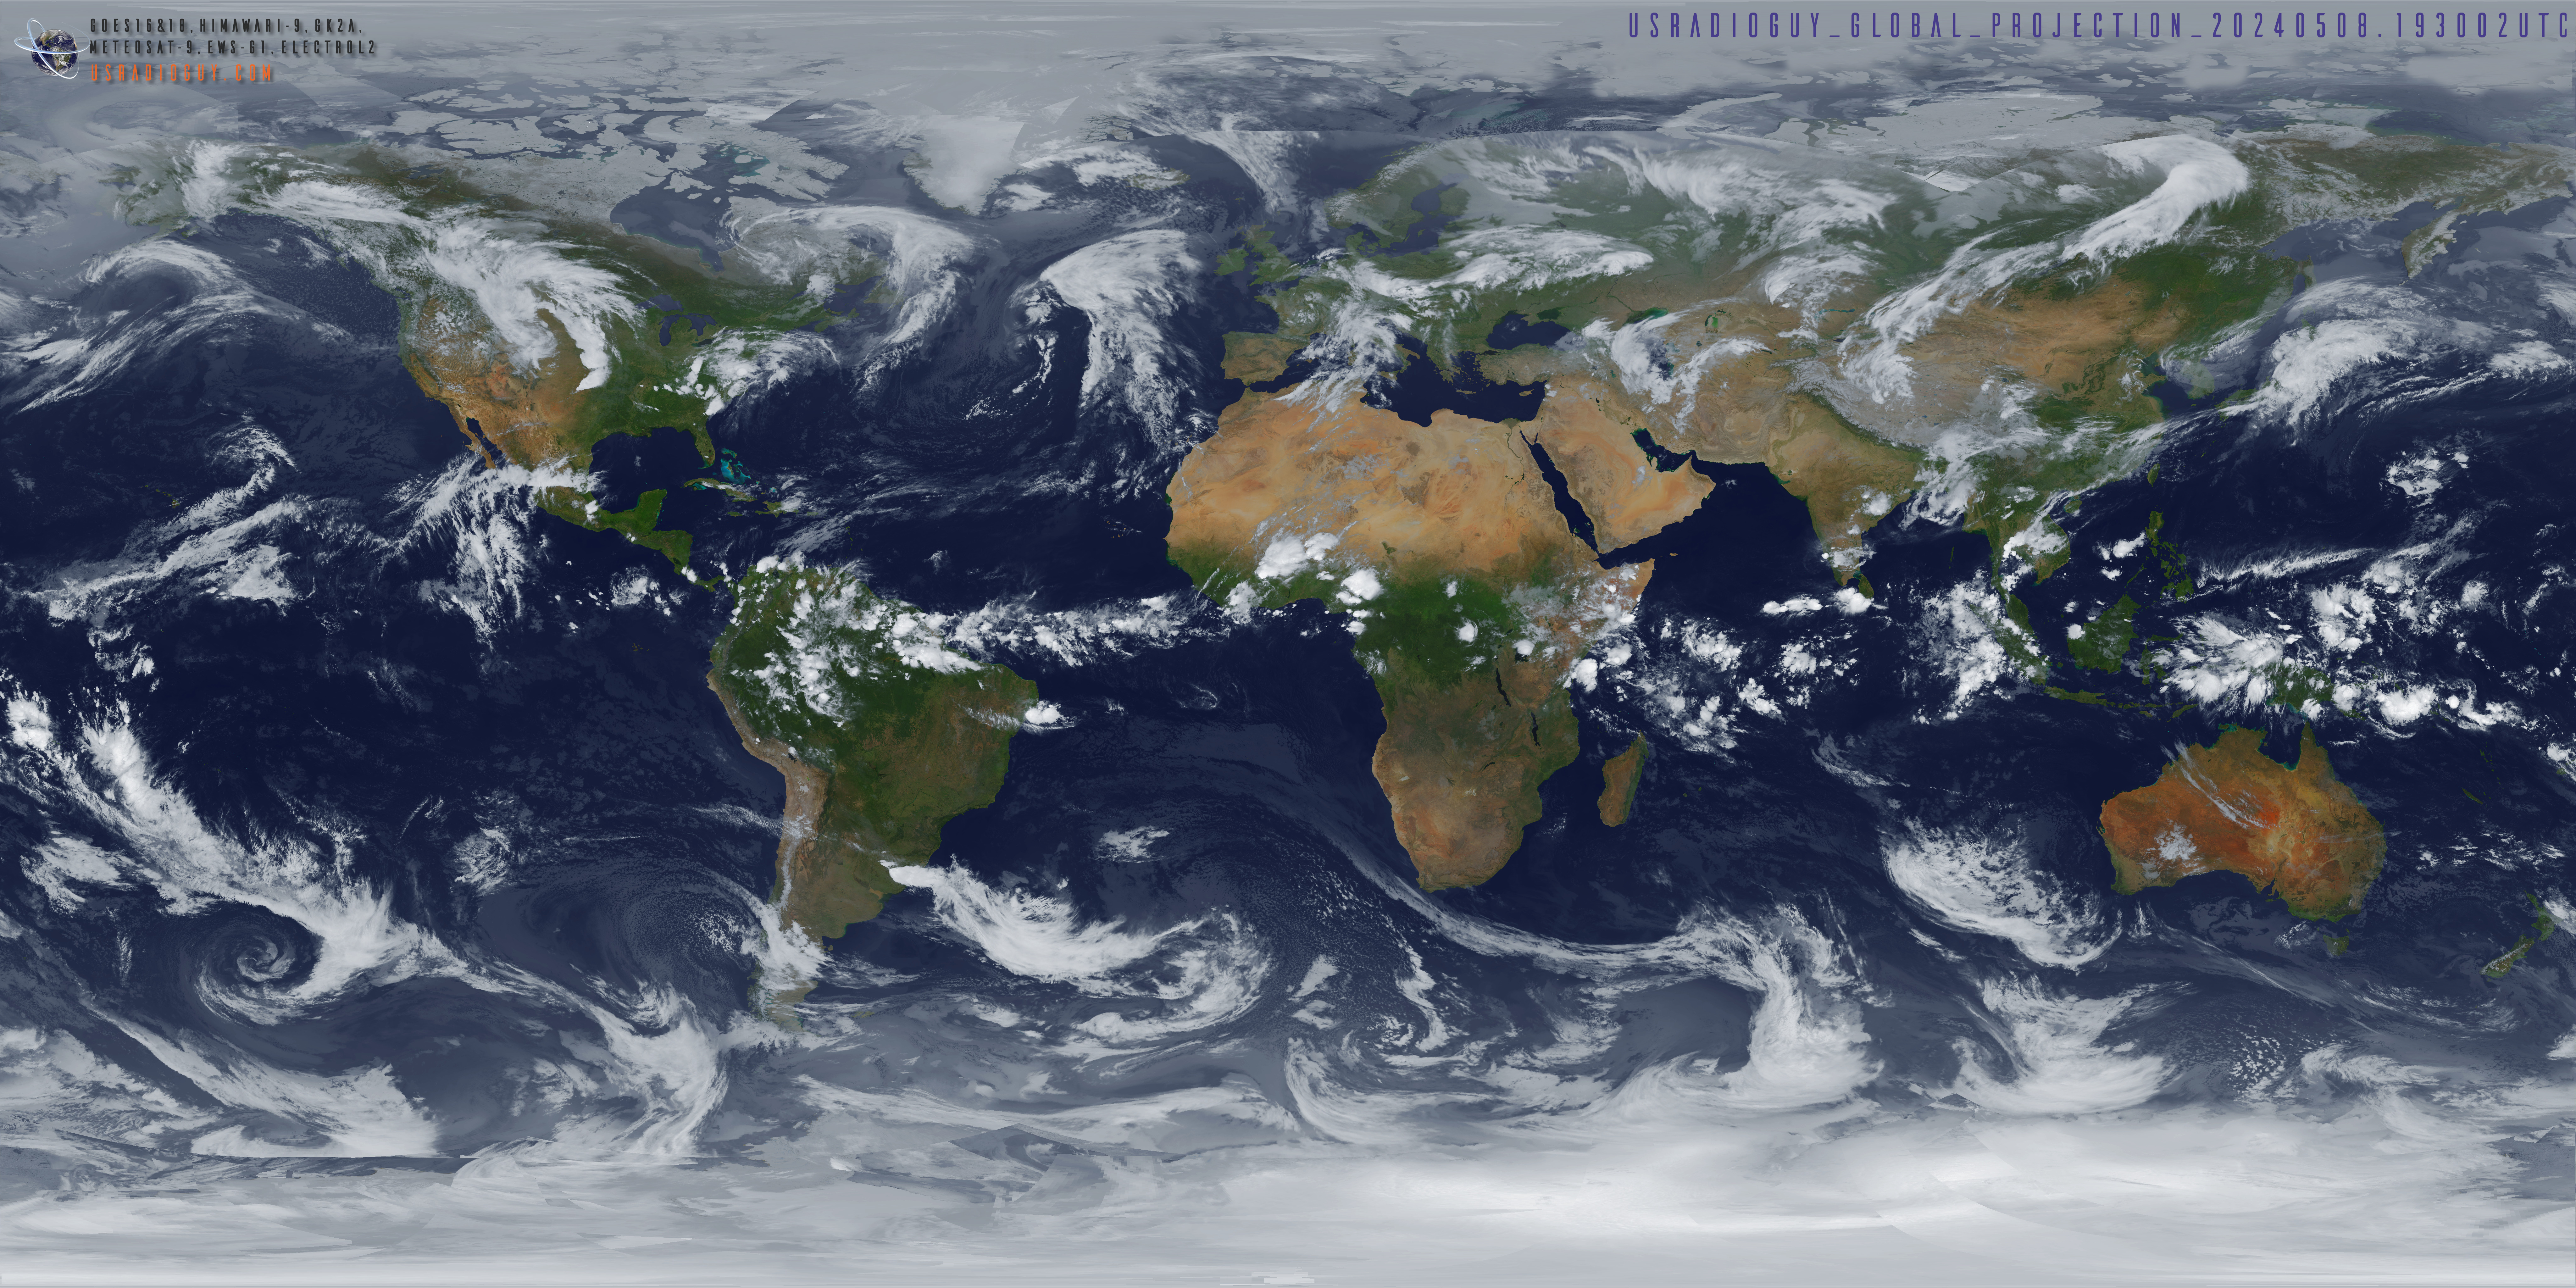
- Using my two dishes, I receive HRIT imagery from GOES-16, GOES-18, and Himawari-9, I also am lucky that I have a few other folks around the globe that share their received imagery with me, from these satellites, EWS-G2, GK2A, and Meteosat-9. From a public repository, I pull imagery from Electro L-2. This is all done via various pieces of software including Goestools, Winscp, etc., and it’s all run 24/7 on my PC and Rasberry Pi’s. This imagery is then composited, automatically, together using Sanchez software to form an equirectangular image of the entire planet using an HD image of the earth as a base layer.
- Then using ImageMajick, an additional cloud layer is added using data from polar-orbiting satellites from the Global Imagery Browse Services (GIBS) – Earthdata – NASA, to ‘fill in’ the gaps in coverage close to the poles (this is because of the parallax effect of viewing a spherical object-the Earth, the edges tend to distort).
- This daily equirectangular projection is then uploaded to my web server for further processing in three.js (below)
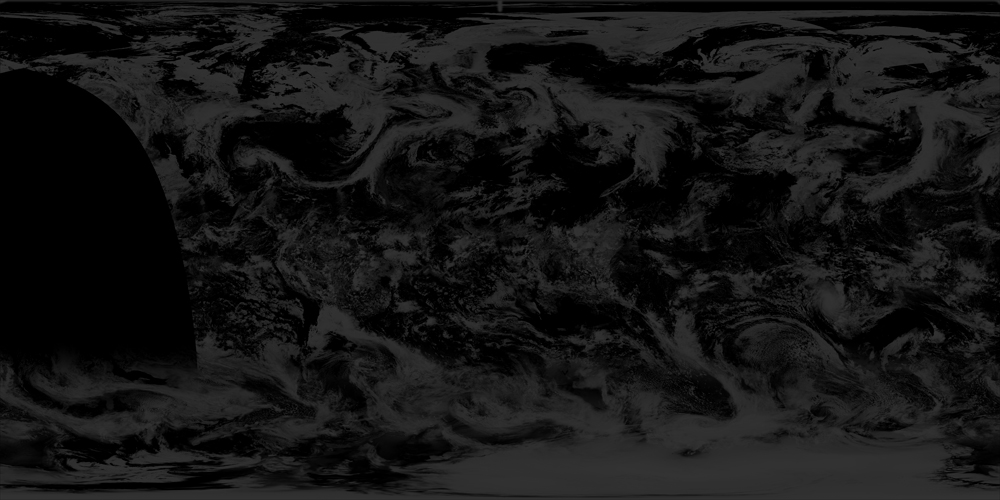
- Another addition to the final 3D animation is created by downloading the current clear sky confidence imagery from GIBS NASA.
- The Clear Sky Confidence image is then processed using JIMP , and a small JavaScript library that turns the clear sky mask into an equirectangular projection of the cloud data only.
- The additional transparent cloud map is then automatically uploaded to my webserver daily for further processing using three.js.
Processing on the Web Server:
Here is where the three.js and html scripting do the task of taking the automatically uploaded imagery, and adding them to create the rendered 3D scene in ‘Space’. This is how that process works:
- First, the html code computes the current date and time of the last planet-wide image, from the previous section and assigns that as the imagery to use in the 3D rendering.
- Now the three.js library is used through java script to render the Earth, moon, orbits, stars, etc.
- First, a virtual ‘camera’ is created that is used to show the rendered view on a web browser.
- Second, orbit controls and lighting effects are established to control the movement and lighting of the virtual universe.
- Next, the ‘earth’ is rendered by the three.js library tools using the previously uploaded global imagery, and cloud layer.
- Specular lighting and an elevation ‘bump’ map is blended with the global composite to give the earth a more realistic appearanceAmbient light is added to the earth as well as a ‘spotlight’ in the position where the sun will be drawn later. This allows the earth to be lit by the ‘sun’.
- Lastly, in the creation of the ‘earth’ a collision detector script with event listeners for mouse and keyboard controls that prevent the camera from flying through the virtual ‘earth’ (otherwise you would see the inside of the planet with a mirror image of the projection.
- Now the three.js library builds the ‘sun’ and places it in the proper position to match the lighting effects. A sun glare is added to the ‘sun’ with just a slight animation to give it more ‘reality’.
- The cloud layer, based on the clear sky confidence imagery is then added to the earth scene, just slightly above the surface. A button on the screen can toggle the extra cloud layer on or off.
- Now the system starts generating geostationary orbit and satellites.
- First, the system generates a geostationary orbit around the earth represented by a red ring. This orbit detail can be toggled on or off by a button on the main screen.
- Next, imagery of the respective satellites is loaded and placed in geostationary orbit. The satellites are placed accurately by coordinates (ie 75.2°W), BUT, due to rendering on a small computer screen, a radius of the orbit is used rather than an actual geostationary orbit (35,786 kilometers (22,236 miles)).
- Next on the list is to generate a 3D starfield, in this case, I used imagery from the Yale Star catalog http://tdc-www.harvard.edu/catalogs/bsc5.html
- Then, the moon is rendered in 3d dimensions, and a small subroutine adds a rotation value to the moon to try and keep the correct side of the moon pointed towards Earth.
- Lastly, a small monitoring script is placed in the upper right corner to monitor ms load time or the frames per second. (This is mostly for testing purposes).
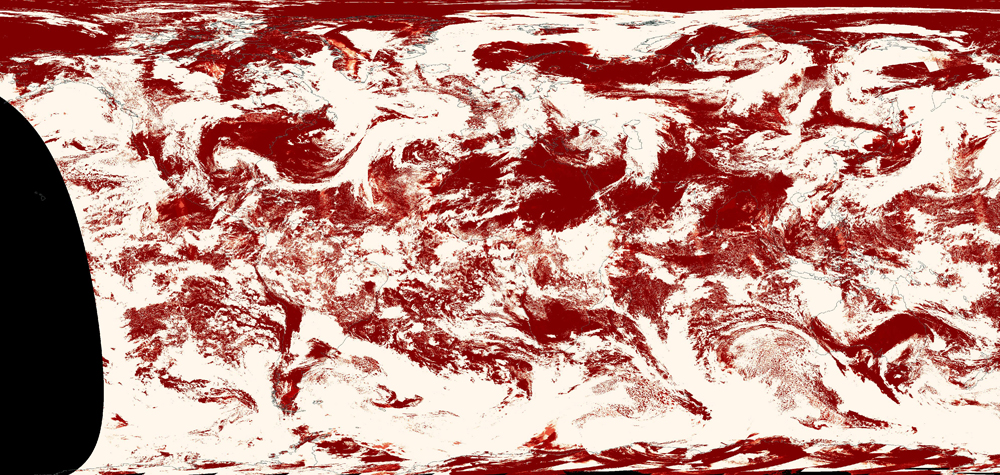
A drawback of using the Clear Sky Confidence is that the polar orbiting satellites tend not to capture the South Pole very well. So, to avoid harsh edges, I use a static image based on Blue Marble Clouds and overlay that on the bottom 20% of the live cloud map that was previously generated. This region isn’t very visible in 3D images anyway, and most of the area is covered by the ice cap which makes the clouds even less visible.
Another drawback is that, occasionally, the satellites capturing the source data will miss some regions. These areas will appear as holes without clouds. And because the satellites orbit the Earth, different regions are captured at different times. Sometimes when adjoining regions are captured at different times, an edge is visible due to the clouds moving between captures. I chose to leave these in and add a button on the 3D view that the user can toggle on or off to see the differences between my sat capture and the cloud layer from NASA GIBS.
