Mesoscale Imagery Defined
Geostationary Mesoscale Imagery: An Overview
Geostationary mesoscale imagery is a type of satellite imagery that provides a constant view of a specific region on Earth. It is captured by the GOES-R series of satellites, which are geostationary satellites that orbit the Earth at the same rate that the Earth rotates. This allows the GOES-R satellites to provide a continuous view of the same region, which is ideal for monitoring weather conditions.
Geostationary mesoscale imagery is typically in the visible and infrared spectrums. This allows the images to capture a variety of atmospheric and weather conditions, including clouds, precipitation, and atmospheric temperature. This information is valuable for meteorologists and weather forecasters, as it can be used to make more accurate weather predictions.
In addition to providing real-time information on weather conditions, geostationary mesoscale imagery can also be used to monitor weather patterns over time. This information can be used to identify potential weather hazards, such as hurricanes and tornadoes. By monitoring weather patterns, meteorologists and weather forecasters can issue early warnings to help protect people and property from these hazards.
Geostationary mesoscale imagery is a valuable tool for meteorologists and weather forecasters. It provides real-time information on weather conditions and allows for more accurate weather predictions. This information can be used to issue early warnings and help protect people and property from weather hazards.
Here are some additional details about geostationary mesoscale imagery:
- The GOES-R satellites have a spatial resolution of 1-4 kilometers, which allows them to capture detailed images of weather systems.
- The GOES-R satellites have a temporal resolution of 30 seconds to 1 minute, which allows them to capture images of weather systems as they change over time.
- Geostationary mesoscale imagery is used by meteorologists and weather forecasters to make more accurate weather predictions, issue early warnings, and help protect people and property from weather hazards.
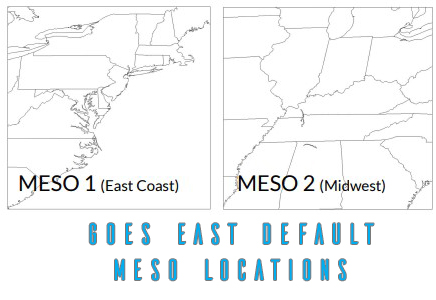
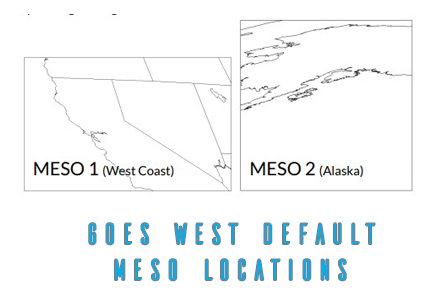
GOES-16 and 18 each have two default domains (see below), however, the domains can be positioned anywhere within the full disk upon request. Requests are placed by National Weather Service (NWS) Weather Forecast Offices (WFOs). You can see the current and future meso plots here https://vlab.noaa.gov/web/towr-s/mmm/meso-view.
They are announced in the ADMSDM product list as well.
 | |
Another benefit of geostationary mesoscale imagery is its high resolution. These images are typically captured at a resolution of 1 km or less, which allows for the detection of smaller-scale weather patterns and features. This level of detail is particularly useful for monitoring and predicting the development of severe weather, such as hurricanes and tornadoes.
When one MESO is tasked with providing 30-second imagery, as they do in some circumstances like hurricanes or when there is a specific research request, the secondary domain, in this case, MESO 2 is NOT active. This is also why it does not appear in your HRIT or GRB feed.
Special Meso Requests: Tailored Satellite Focus for Unique situations
NOAA’s geostationary satellites, particularly the GOES-R series, play a crucial role in weather monitoring. But beyond their routine observations, there’s a fascinating program called Special Meso Requests. This program allows for targeted use of these powerful satellites to zoom in on specific areas during unique or critical events, and special research requests.
Imagine a high-profile event like a rocket launch, a major sporting competition, or a large outdoor gathering. Unpredictable weather can significantly disrupt these events, potentially causing delays, cancellations, or even safety hazards. Special Meso Requests allow organizers and authorities to request enhanced mesoscale coverage of a specific area for the duration of the event.
Here’s how it works:
- Request Submission: Event organizers or relevant authorities can submit a request to NOAA, outlining the specific event, its location, or research opportunity and the desired timeframe for enhanced coverage.
- Focus on the Region: Once approved, NOAA can task one or more GOES-R satellites to increase the frequency of imagery for the designated area. This means more frequent images are captured, providing a more detailed and near-real-time view of weather developments.
- Duration Flexibility: Special Meso Requests are highly adaptable. Coverage can be as short as an hour for a specific event window, or it can extend for the entire duration of a multi-day event.
Benefits of Special Meso Requests:
- Enhanced Situational Awareness: With more frequent imagery, meteorologists can closely monitor weather patterns in the designated area. This allows for better detection of potential threats like sudden storms or shifting wind patterns.
- Improved Decision-Making: Having a more detailed understanding of the evolving weather situation empowers event organizers and authorities to make informed decisions. This can involve delaying an event, implementing preventative measures, or even issuing an evacuation order if necessary.
- Increased Public Safety: By proactively identifying and addressing potential weather risks, Special Meso Requests can help ensure the safety of participants, spectators, and everyone involved in the event.
Examples of Special Meso Requests:
- Monitoring a unique weather system, a particularly dangerous storm, or other atmospheric event.
- Monitoring the launch window for a critical space mission to ensure optimal weather conditions. They have even tried to capture extra atmosheric events such as the pass of comet NeoWise.
- Providing continuous weather updates during a major outdoor concert or sporting event to identify any developing threats.
- Tracking weather patterns during a high-profile political event or summit.
Special Meso Requests showcase the versatility and adaptability of NOAA’s geostationary satellite program. By offering targeted focus during critical events, this program contributes to smoother operations, enhanced public safety, and ultimately, a better understanding of our ever-changing weather patterns.
 GOES- T Launch Meso from GOES -17 GOES- T Launch Meso from GOES -17 |  GOES- T Launch Meso from GOES -16 GOES- T Launch Meso from GOES -16 |
National Special Security Events (NSSE)
On occasion, the Department of Homeland Security may designate an event NSSE or National Special Security Event (NSSE). An NSSE is a designated event that, due to its political, economic, social, or religious significance, may be the target of domestic/international criminal activity (terrorism) as a result of national significance and high visibility, requiring the lead of Secret Service.
Examples of submitted events have included the Super Bowl, Indianapolis 500, US Open, and the Kentucky Derby. A SEAR rating is applied to those types of events based on risk assessment. The Super Bowl may only necessitate a Level 5 SEAR and require NOAA, to provide coverage for meteorological monitoring. This then would generate a request for specific mesoscale imagery.
Special Event Assessment Rating(SEAR) Events
A SEAR is a similar event not of the same magnitude or significance as an NSSE, but
involving the lead interagency effort of DHS, USSS, and the FBI.
- SEAR-I: Events of such magnitude and significant national and/or international importance that may require the full support of the United States Government
(USG). - SEAR-II: Significant events with national and/or international importance that
may require direct national federal support and situational awareness. - SEAR-III: Significant events with national and/or international importance that
may require only limited direct federal support to augment local capabilities. - SEAR-IV: Events with limited national importance that generally require state
and local resources. - SEAR-V: Events that may be nationally recognized but generally have local or
state importance.
How Does the ABI scan the earth?
The Advanced Baseline Imager (ABI) on the GOES-R satellites scans the Earth using a technique called push-broom scanning. In push-broom scanning, the ABI’s 16 detectors are arranged in a line, and the line is swept across the Earth’s surface as the satellite orbits. The ABI takes measurements of the Earth’s surface and atmosphere at each point along the line, and these measurements are used to create images of the Earth.
The ABI scans the Earth from west to east, and it takes about 10 minutes to scan the entire Earth’s disk. The ABI can also scan smaller areas, such as specific storm systems, in more detail.
The ABI’s push-broom scanning technique allows it to create high-resolution images of the Earth’s surface and atmosphere. The ABI’s images are used by meteorologists and other scientists to study weather patterns, track storms, and monitor environmental conditions.
Here are some additional details about how the ABI scans the Earth:
- The ABI’s detectors are arranged in a line that is 3.7 meters long.
- The ABI scans the Earth at a rate of 10 kilometers per second.
- The ABI takes measurements of the Earth’s surface and atmosphere at a spatial resolution of 1-4 kilometers.
- The ABI takes measurements of the Earth’s surface and atmosphere at a temporal resolution of 30 seconds to 1 minute.
This video shows how the Advanced Baseline Imager scans the earth providing different MESO’s, CONUS, Full Disks, etc.