

ORBITAL DYNAMICS 101
![]()
Orbital mechanics govern the movement of everything from planets to our ever-growing fleet of satellites. Understanding these dynamics is crucial for space agencies, telecommunication companies, weather satellite enthusiasts, and anyone interested in the choreography of objects orbiting Earth.
Orbital mechanics is the study of how objects move under the influence of gravity. It is a fundamental concept in physics and engineering, and it is used to design the trajectories of spacecraft, satellites, and even interplanetary probes.
The foundation of orbital mechanics is Isaac Newton’s law of universal gravitation, which states that every particle in the universe attracts every other particle with a force that is directly proportional to the product of their masses and inversely proportional to the square of the distance between their centers.
In simpler terms, gravity gets weaker as objects get farther apart, and stronger as objects get more massive.
Here are the basic principles of orbital mechanics:
- Newton’s Laws of Motion: These laws describe the relationship between an object’s motion and the forces acting on it.
- Law of Universal Gravitation: This law describes the force of gravity between two objects.
- Orbital Paths: Objects in orbit follow a specific path, which is usually an ellipse, but can also be a circle, parabola, or hyperbola.
- Orbital Velocity: The speed at which an object travels in its orbit depends on its distance from the central body and the mass of the central body.
- Escape Velocity: The minimum speed required for an object to escape the gravitational pull of a body and travel into outer space.
These principles can be used to calculate the trajectory of a spacecraft, the time it will take to complete an orbit, and the amount of fuel required for a mission.
Orbital mechanics is a complex field, but the basic principles are relatively simple. By understanding these principles, you can gain a basic understanding of how objects move in space. This article explores how ANSYS STK, a powerful visualization and analysis tool, can be used with Two-Line Element Sets (TLEs) to visualize both Low-Earth Orbit (LEO) polar-orbiting satellites and Geostationary (GEO) satellites.
TLEs: The Rosetta Stone of Orbits
Two-Line Element Sets, or TLEs, are data sets containing essential information about a satellite’s orbit. Publicly available from organizations like the US Air Force Space Command, Celestrak, and Space-Track, TLEs include parameters like inclination (the angle of the orbit relative to the equator), semi-major axis (orbital distance), and eccentricity (orbital shape). With these parameters, software like STK, and others, like Orbitron, Grpredict, Satdump, can calculate the satellite’s position over time. Keeping your system updated is essential.
Two-Line Element Sets (TLEs) aren’t created out of thin air. They are the product of meticulous observation and mathematical modeling. Here’s a breakdown of the process:
- Tracking the Dance: Ground-based radar systems, optical telescopes, or a combination of both meticulously track the movements of satellites. These observations capture the satellite’s position and direction at specific points in time.
- Data is King: The collected data points serve as the raw material for creating a TLE. Imagine these points as snapshots of the satellite’s location at different moments.
- The Fitting Process: Specialized software employs a mathematical technique called least squares estimation. This process analyzes the observation data and fits a mathematical model to it. This model represents an approximation of the satellite’s average or “mean” orbit.
- Accounting for Wobble: A perfect orbit doesn’t exist. Earth’s bulge, atmospheric drag, and lunar/solar gravitational effects all influence a satellite’s path. The mathematical model used to create the TLE factors in these average perturbations, provides a more realistic picture of the orbit.

Encoding the Essentials: The final TLE condenses the key orbital elements like inclination, semi-major axis, and eccentricity into a concise two-line format (though three-line formats with a descriptive name are also used).
Example of a TLE for GOES-16:
GOES 16
1 41866U 16071A   24190.75135017 -.00000250  00000+0  00000+0 0  9991
2 41866   0.0760 248.8039 0000215 201.1579  32.4914  1.00272671 28006
Want to read a lot more detail about TLE’s?
TLEs: A Deep Dive into the Components of TLEs
Satellite Catalog Number
Every object launched into space gets a unique identifier assigned by USSPACECOM. This five-digit number spans from 00001 to 99999. A recent adaptation, Alpha-5, expanded this range to encompass 339,999 objects. The first digit in this scheme is encoded as a letter.
Only capital letters and numbers are used in Alpha-5. The letters “I” and “O” are omitted to avoid confusion with the numbers “1” and “0”
| Letter | Value | Letter | Value | Letter | Value |
|---|---|---|---|---|---|
| A | 10 | J | 18 | S | 26 |
| B | 11 | K | 19 | T | 27 |
| C | 12 | L | 20 | U | 28 |
| D | 13 | M | 21 | V | 29 |
| E | 14 | N | 22 | W | 30 |
| F | 15 | P | 23 | X | 31 |
| G | 16 | Q | 24 | Y | 32 |
| H | 17 | R | 25 | Z | 33 |
Example:
25544: Standard catalog number
A2554: Alpha-5 encoded number for 102554
F2554: Alpha-5 encoded number for 152554
U2554: Alpha-5 encoded number for 282554
Catalog numbers are sequential. Lower numbers denote older satellites, while higher ones indicate recent launches or newly identified space debris.
Classification
Each TLE carries a classification: either “U” for unclassified or “S” for secret classified objects. Public data sets always carry the “U” classification.
International Designator
This identifier connects a satellite’s catalog number to its launch event. The format is YYNNNP:
- YY: Last two digits of the launch year
- NNN: Launch number for that year
- P: Launch piece (from A to ZZZ)
16071A: the 71st launch in 2016, piece A ----Example Using GOES-16Epoch
The epoch offers a timestamp, revealing when the orbital data was recorded. It combines the year (two digits) and the day of the year (decimal).
24190.75135017: equates to: 2024-07-08T18:01:56.655Z ----from the GOES-16 example aboveTLE epoch conversion to date-time
| Input the TLE epoch number: | |
| Date-time: |
Inclination
The inclination represents the tilt of the satellite’s orbit concerning Earth’s equator. It defines the angle between the orbital plane and the equatorial plane. A satellite with a 0-degree inclination would orbit directly above the equator, while a satellite with a 90-degree inclination would move over the poles.
Right Ascension of Ascending Node (RAAN)
RAAN specifies the orientation of the orbit. To visualize this, imagine the intersection points where the satellite crosses the equatorial plane. The ascending node is the point where the satellite moves from the southern hemisphere to the northern hemisphere. RAAN is the angle between the vernal equinox (a reference direction in space) and this ascending node.
Eccentricity
Eccentricity provides a measure of the shape of the satellite’s orbit, helping determine how much it deviates from a perfect circle. An orbit with an eccentricity of 0 is circular, while an orbit with an eccentricity close to 1 is highly elliptical.
Argument of Perigee
This element represents the orientation of the orbit’s closest point to Earth (perigee) relative to the ascending node. Essentially, it’s an angle that indicates where the satellite is closest to Earth in its orbit.
Mean Anomaly
The mean anomaly is a measure of the satellite’s position along its orbit. It defines where the satellite is in its elliptical orbit around Earth at the epoch time, specified in the TLE.
Mean Motion
Mean motion indicates the number of orbits the satellite completes in one day. It provides an average rate at which the satellite revolves around Earth.
Geostationary (GEO) satellites have a mean motion of 1.0027 orbits per day. Medium Earth Orbit (MEO) satellites have a mean motion of around 11.25 orbits per day. Low Earth Orbit (LEO) satellites have a mean motion of around 14.2 orbits per day.
First and Second Derivatives of the Mean Motion
These derivatives indicate the rate of change and acceleration of the satellite’s mean motion, respectively. They can help in predicting the future state of the satellite’s orbit, especially if the orbit is affected by drag or other perturbing forces.
Checksum
Lastly, the checksum is crucial for ensuring the integrity of TLE data. This element ensures that the data hasn’t been tampered with or corrupted, providing a way to detect errors.
It is time to Retire TLE
The TLE format has been a workhorse for the space community for over half a century. But limitations on data transmission from the 1970s are no longer relevant. Sticking with TLE hinders progress by restricting the amount of data we can share and forcing users to awkwardly adapt it to modern needs.
Space-Track.org urges users to adopt a more flexible format like XML, KVN, or JSON. These formats can handle the ever-growing catalog of space objects, regardless of how many there are.
Cis-Lunar Space
The TLE format was designed for Earth-orbiting satellites. However, with the rise of space exploration, the need to track objects beyond Earth’s orbit is growing. This includes the Moon, Mars, and other celestial bodies. The TLE format and SGP4 is not suitable for these objects, as it relies on Earth as the central body. New models and formats are required to track objects in cis-lunar space.
Essentially, a TLE is a snapshot of a satellite’s average orbit, taking into account real-world influences that cause deviations from a perfect path. It’s a constantly evolving record, with new TLEs generated periodically to reflect changes in the satellite’s trajectory.
Visualizing LEO and GEO Satellites Orbital Dance: LEO & GEO Satellites with ANSYS STK
Visualizing LEO Polar Orbits
LEO satellites, orbiting a few hundred kilometers above Earth, offer high revisit rates ideal for Earth observation missions. Their polar orbits, with inclinations near 90 degrees, ensure complete coverage of the planet. Using STK, I imported the LEO satellite’s TLE data for the satellites I typically receive, or use for imagery processing. The software then calculates the satellite’s trajectory, allowing me to:
- Animate the satellite’s path: View the satellite’s ground track and sensor coverage as it circles Earth, observing its daily precession due to Earth’s rotation.
- Show the Sensor Coverage: Using the information from the satellite information file, I plot the scan path that the satellite uses as it orbits the earth.
- Overlay ground features: Integrate geographical data like landmasses and oceans, providing context to the satellite’s movement. In the example I use here, I used global satellite imagery that I combined to render a view of the earth. In addition, I add a layer to visualize the changed shadow and city lights as the earth rotates in regard to the position of the sun.
- Simulate time: This example was rendered with data from July 7th, 2024 to July 8th 2024 with a time step of 320 seconds.
Geostationary Wonders: A Different Perspective
GEO satellites, positioned at an altitude of approximately 36,000 kilometers, maintain an orbit that is in a constant position relative to Earth’s surface. This allows them to provide vital services like continuous telecommunication coverage and important weather monitoring. Visualizing GEO satellites in STK requires a slightly different approach than LEO satellites:
- Placing the satellite at the geostationary belt: Using current TLE’s from Celestrack, the software positions the satellite at the designated orbital altitude and sets its inclination to zero degrees or to what is specified in the TLE (Some geosats like Elektro L2 have a north south wobble to their orbit..
- Simulate Earth’s rotation: Since the satellite appears stationary relative to Earth, I set STK to simulate Earth’s rotation to create the illusion of the satellites orbiting over a specific location.
- Show the Sensor Coverage: Using the information from the satellite information file, I plot the scan path that the satellite uses as it orbits the earth. Note how the sensor scans only cover a portion of the earth within their view, or “footprint”, by using satellites with overlapping coverage, it is possible to get a full Global coverage map, which in this case, I use as the base map for the digital rendering.
- In this image, I left out coverage from EWS-G2 to show how the satellite “footprint” can affect the total global composite:
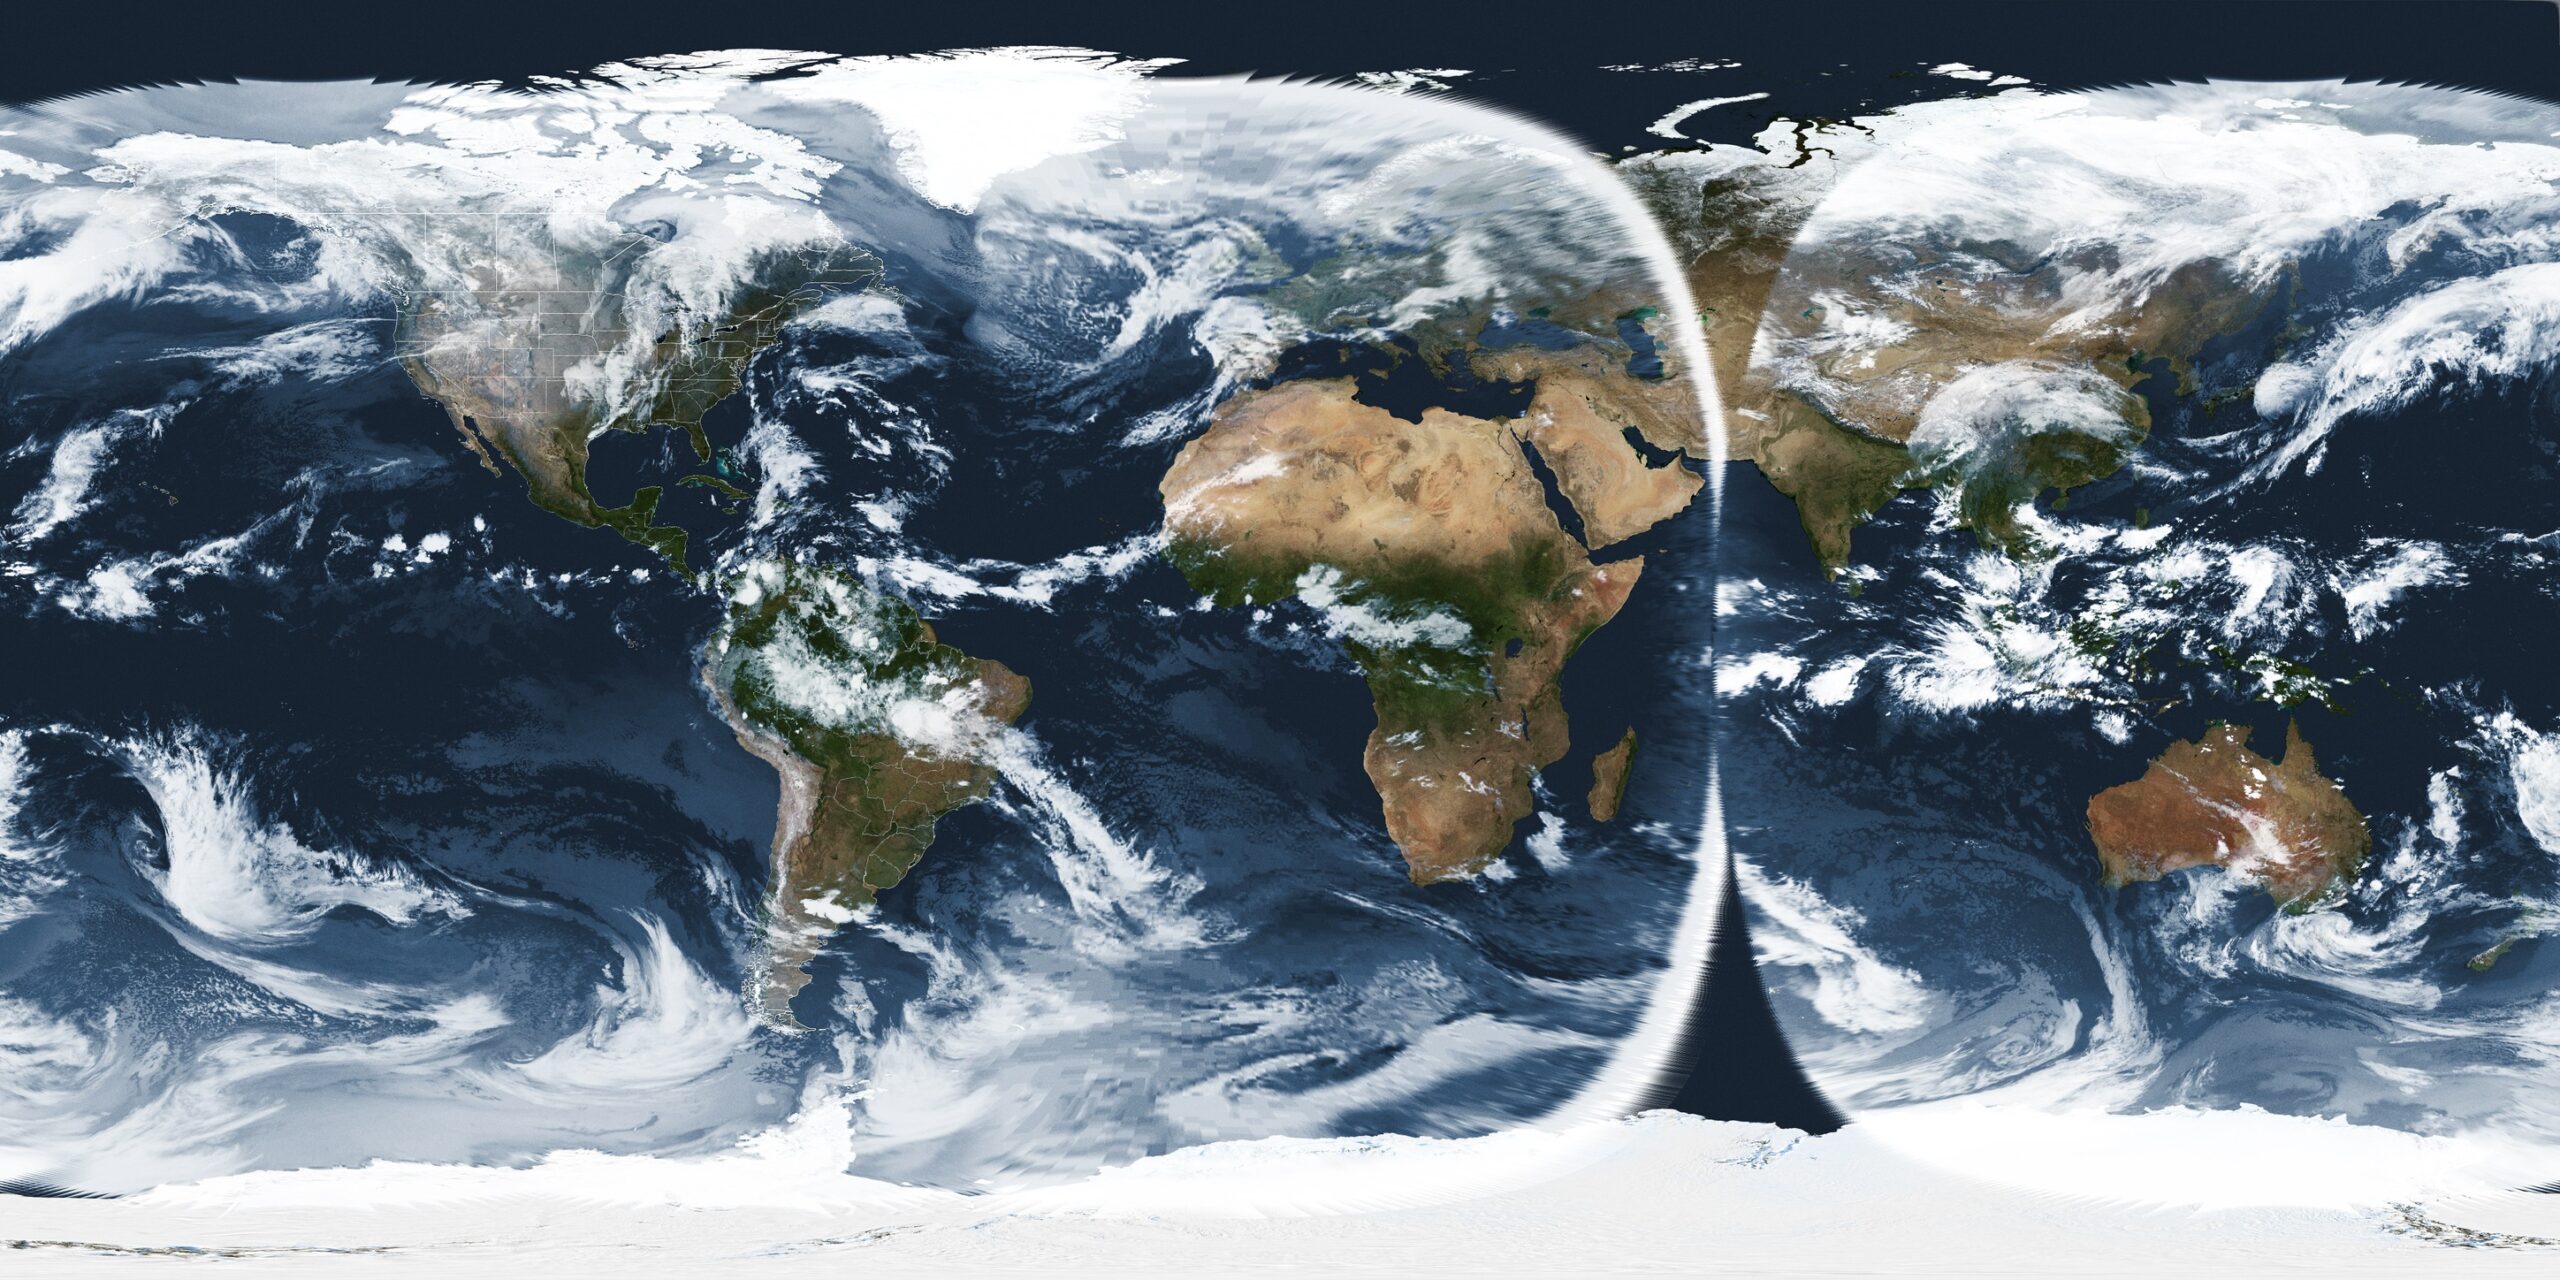
- In this image, I left out coverage from EWS-G2 to show how the satellite “footprint” can affect the total global composite:
- Simulate time: This example was rendered with data from July 7th, 2024 to July 10th 2024 with a time step of 120 seconds.
Benefits of Visualization
Visualizing satellite orbits using visualization software offers several advantages:
- Satellite Operations Planning: Crucial for satellite owners to manage daily operations.
- Space Situational Awareness: Governments and militaries rely on TLE data for space domain awareness.
- Scientific Observation: Astronomers use TLEs to coordinate Earth and space observations.
- Engineering Analysis: TLEs offer insights for both launch and on-orbit operations.
- Enthusiast Tracking: Amateur satellite observers worldwide use TLEs to track and observe various space objects
Conclusion
ANSYS STK, along with readily available TLE data, provides a powerful platform for visualizing the dynamic world of Earth’s orbiting satellites. By harnessing the power of orbital mechanics, we can gain valuable insights into the intricate dance of these technological marvels.