
![]()
Vitality GOES- A tool to work with imagery and data created by goestools and/or Satdump
Jamie Vital has built a Web App for showcasing Geostationary Weather Satellite Data. The software is designed to display text and images received from GOES satellites via goestools and satdump.
UPDATE: 3/08/2025
The latest version as of this writing is Vitality GOES – 1.5.3 with several new features! The update has something for many of us, no matter where in the world we are.
What’s new in Vitality GOES 1.5.3
- added example configs for SatDump 1.2.1 composite names, and its new L2/non-cmip processing. You must be on the yet-to-be-released SatDump 1.2.1, or the latest nightly, for the new configs to work. Note: there is no code change here – if you only want to add SatDump’s new composites to Vitality GOES, you only need to look at the new example configs.
- Added support for Special Weather Statements.
- Fixed all SatDump example configs to work on Linux.
- Fixed multiple bugs in displaying the current weather. However, there is more to do here!
- Fix a few bugs in the video rendering scripts
- Added support for displaying timelapse videos from a URL instead of the
videos/folder
You can get the newest version from https://github.com/JVital2013/vitality-goes. Note this version requires updating your config files as well At least the change gives you more flexibility and the ability to support more satellites.
SatDump is supported for Windows/Linux! This makes it so you can run the entire stack (SDR -> SatDump -> Vitality GOES) all on one Windows Host, which could be helpful for some folks. Jamie put together a video at https://www.youtube.com/watch?v=XMDAiUjzkhw that goes over how to throw together a setup that can be evolved into a full, Windows-based ground station. I think one of the great features of this app is the ability to sort and make useful the thousands of EMWIN images, text, forecasts, radar, etc. that can be received.
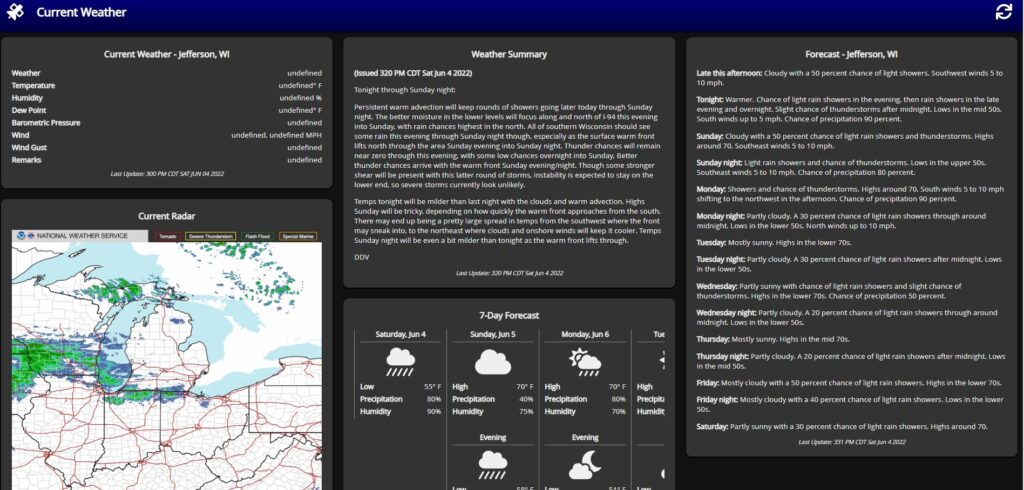
One newer feature is an “Alert” that appears at the top of the local weather page that lets the user know if there are any warnings/watches or other weather emergencies.
Jamie Vital has built a Web App for showcasing Geostationary Weather Satellite Data. The software is designed to display text and images received from GOES satellites via goestools.
The author has written a great description of the software package he created and has it over on his github page which you can find here: https://github.com/JVital2013/vitality-goes
What does Vitality GOES do?
Vitality GOES makes data from the GOES HRIT/EMWIN feed easily accessible, through a web browser, from anywhere on your local network. Even if the internet goes down, people on your local LAN can still access real-time weather information.
Vitality GOES has the following features:
- Once set up by the ground station technician (you!), Vitality GOES is easily usable by anyone with no knowledge of radio, satellites, or programming.
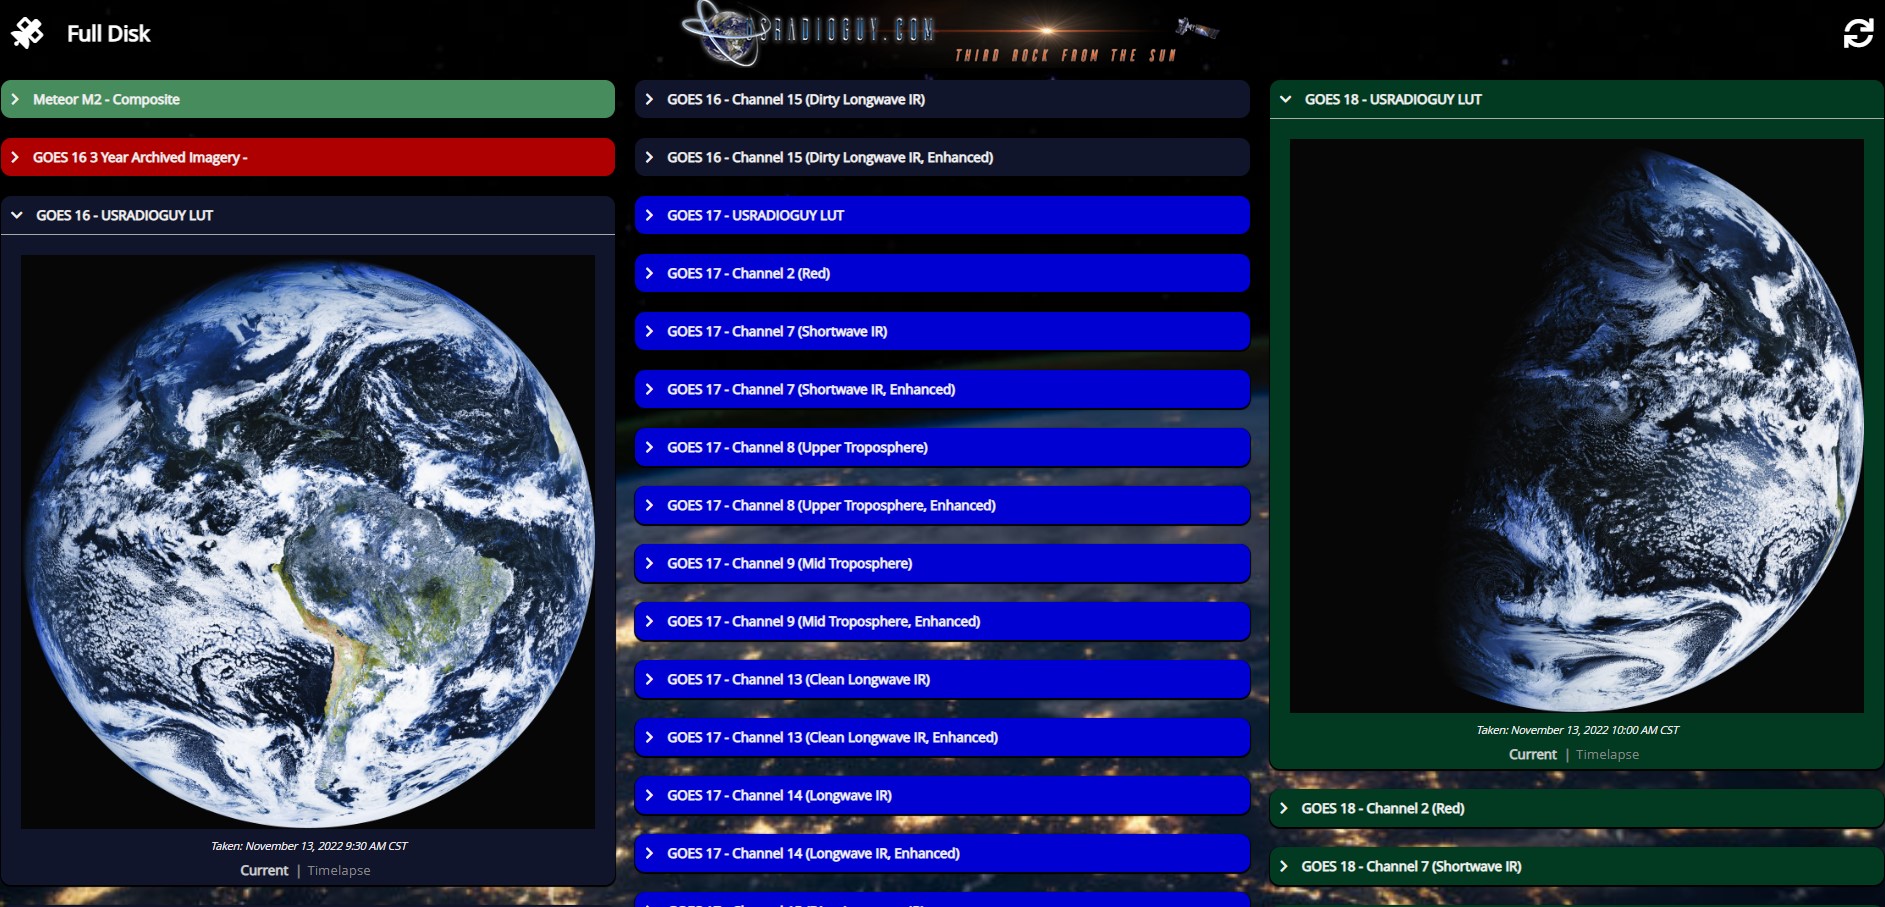
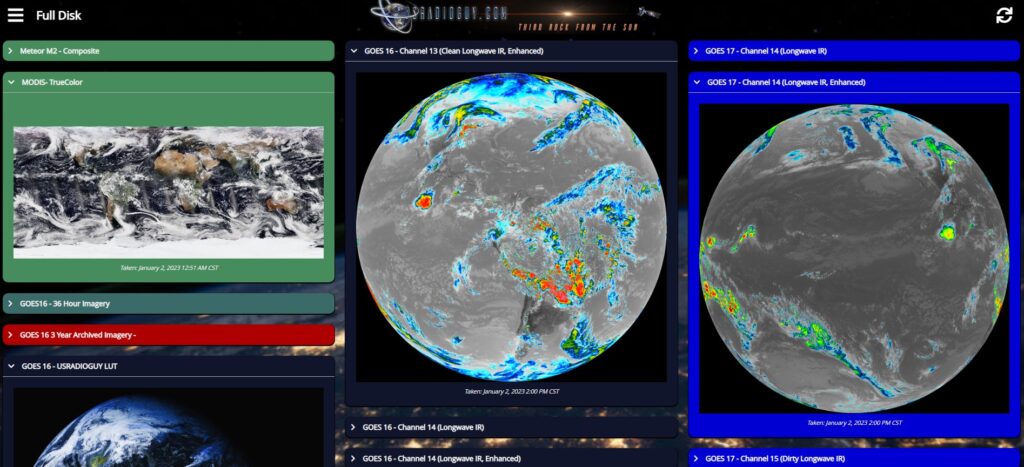
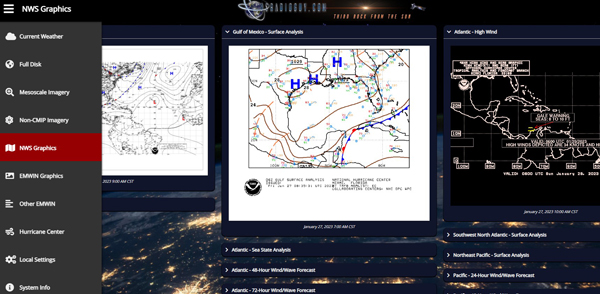
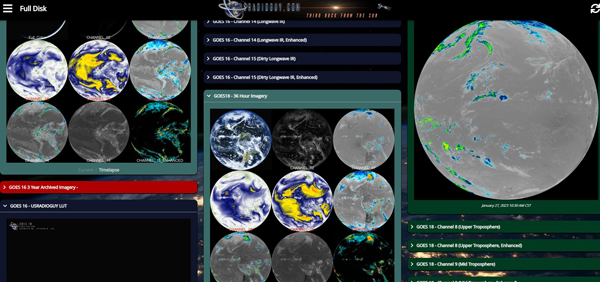
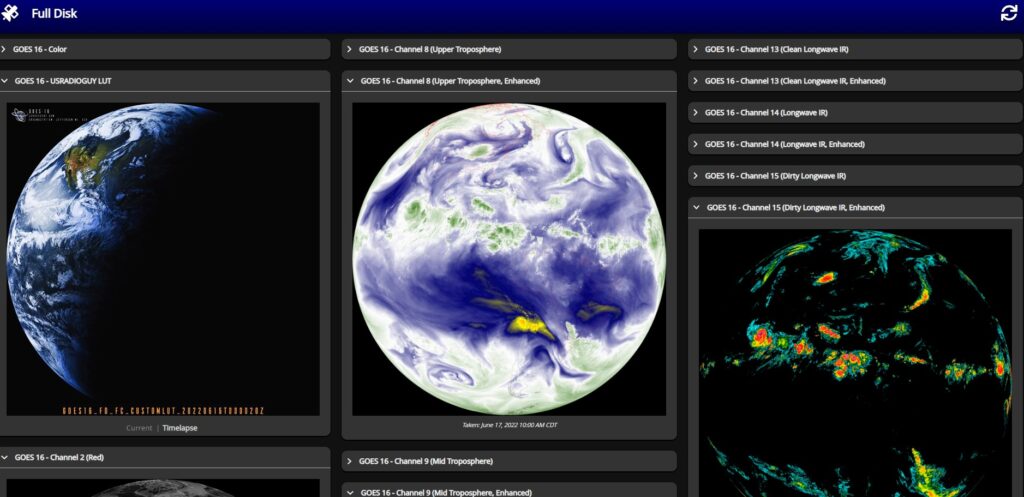
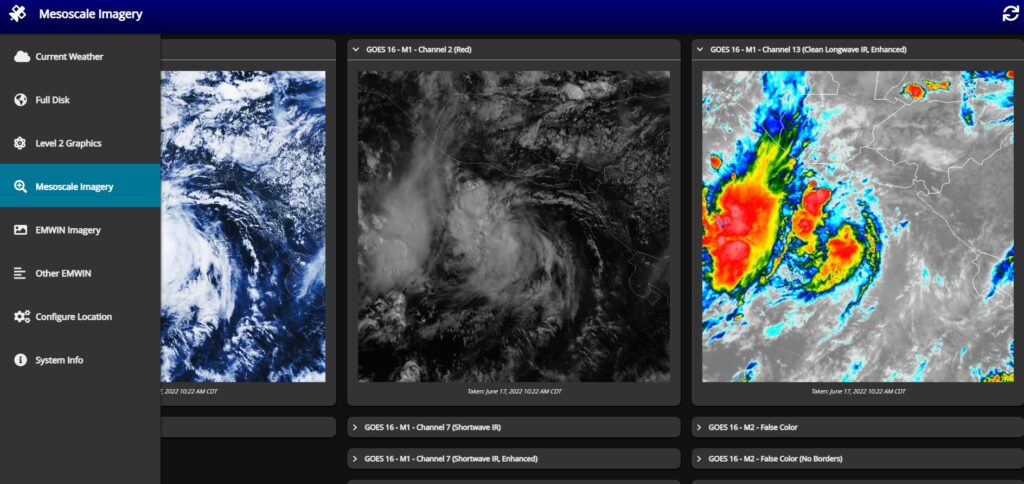
- It presents all full-disk, Level 2 products, and mesoscale imagery in a user-friendly and easily navigatable way.
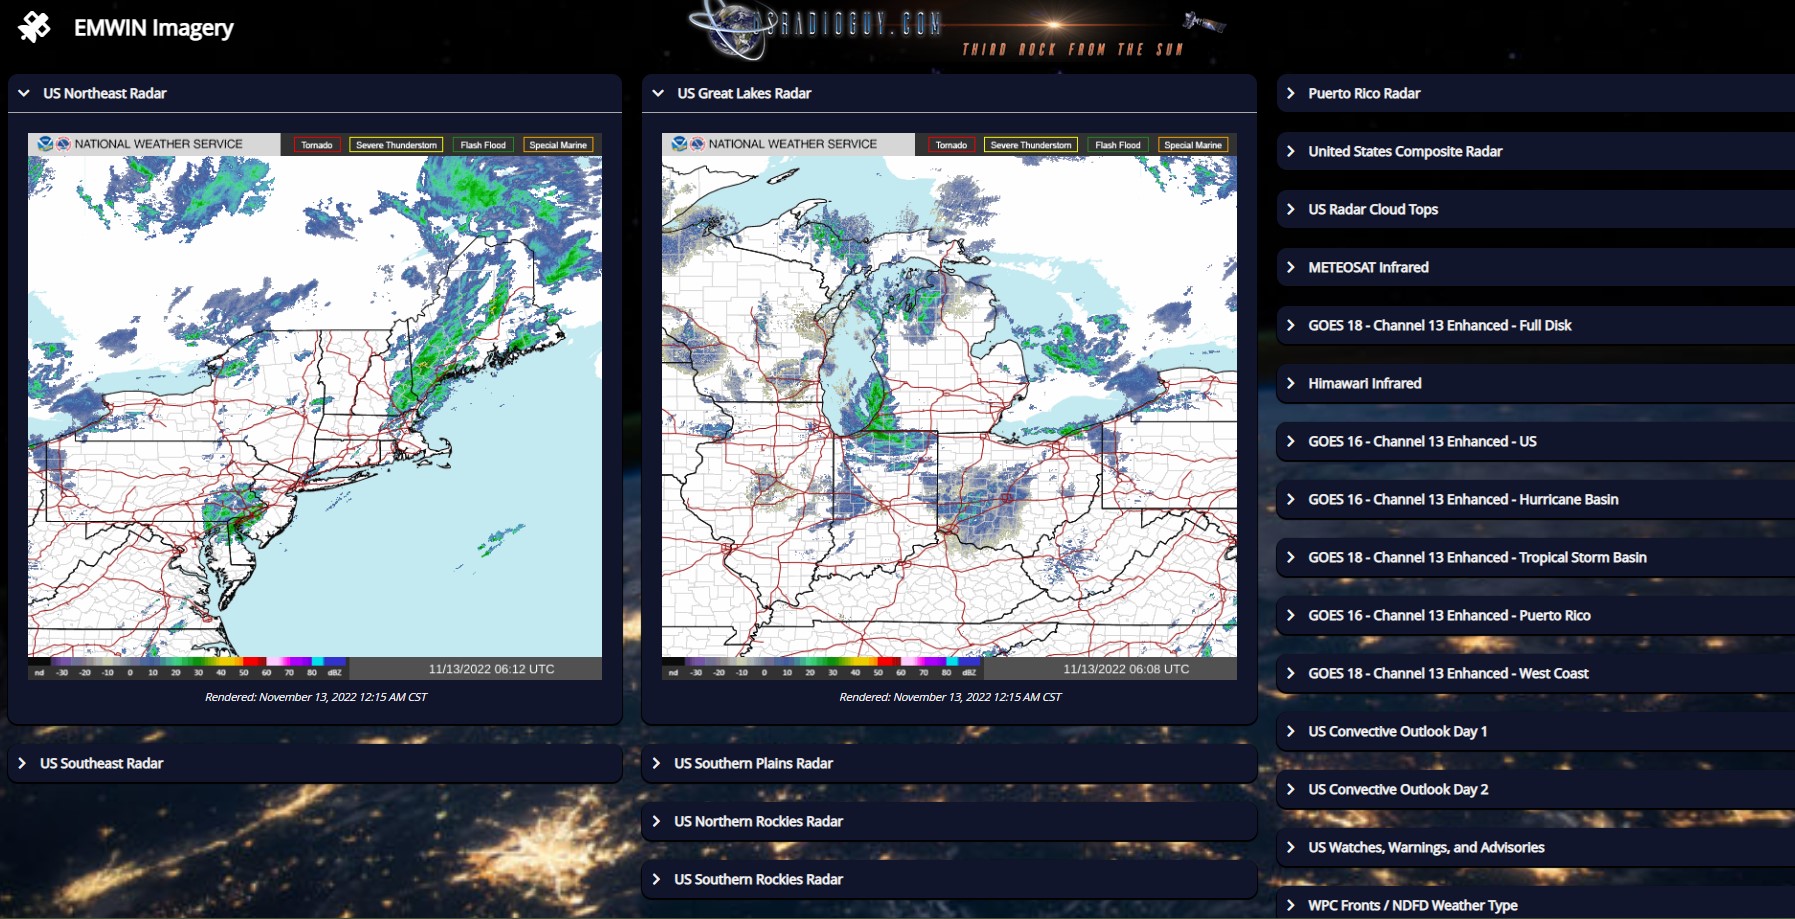
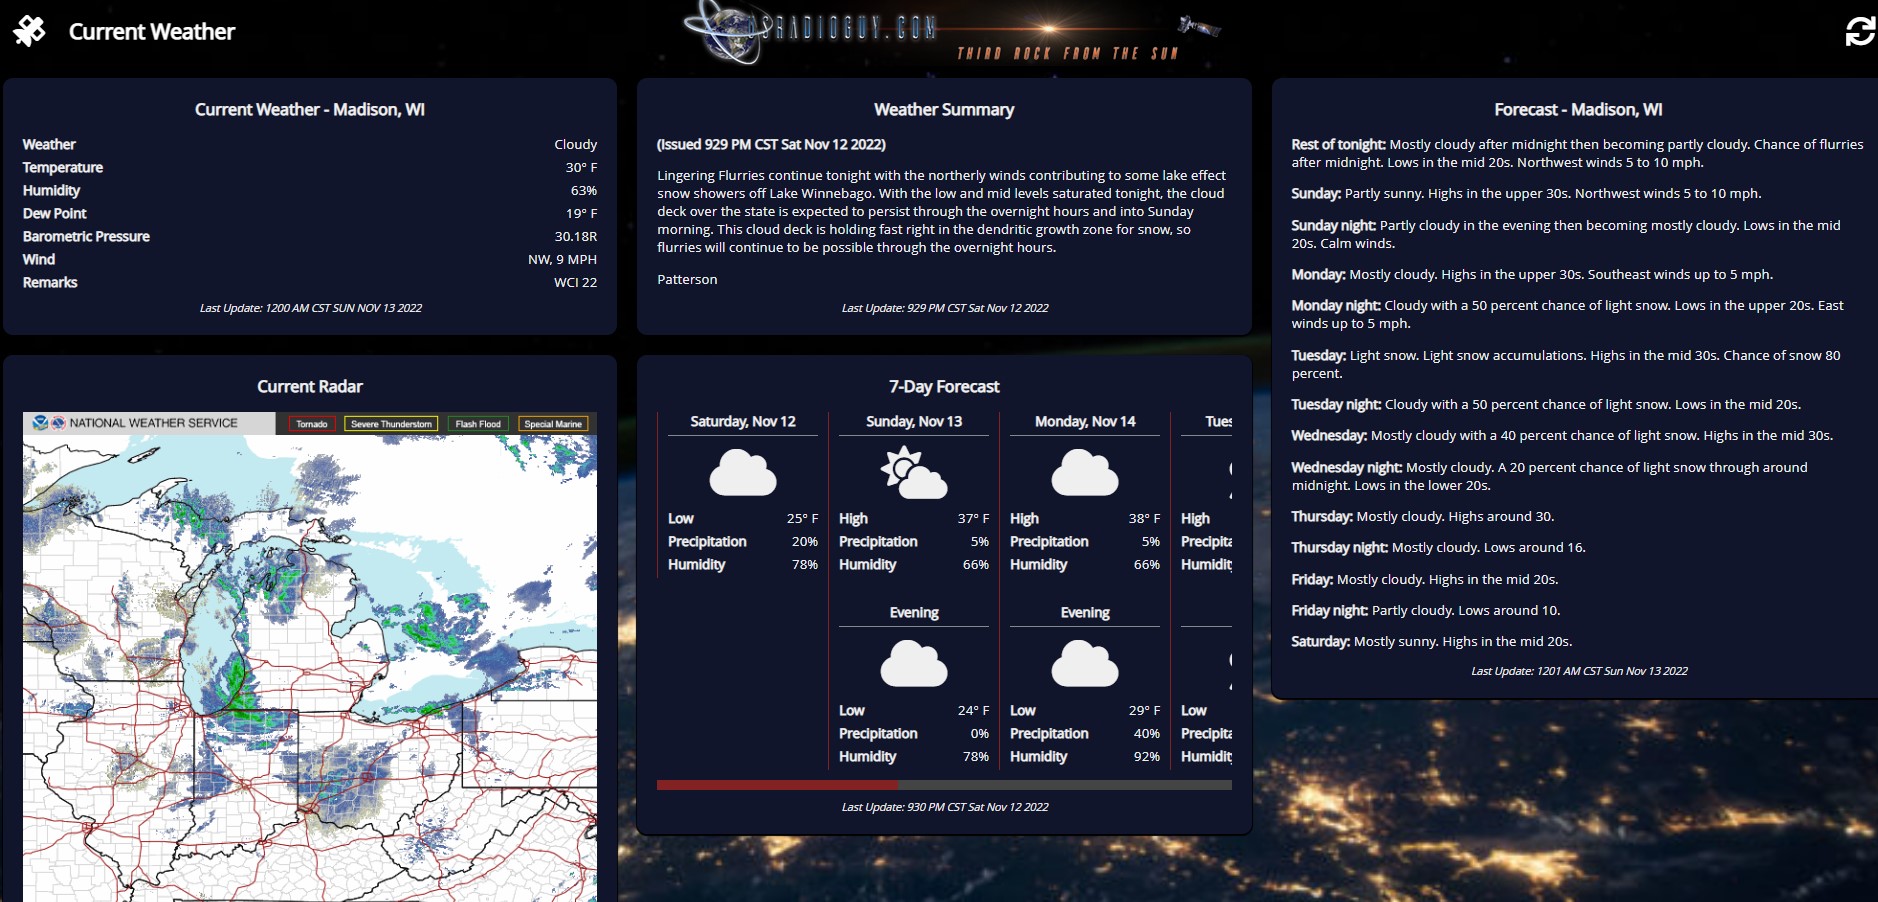
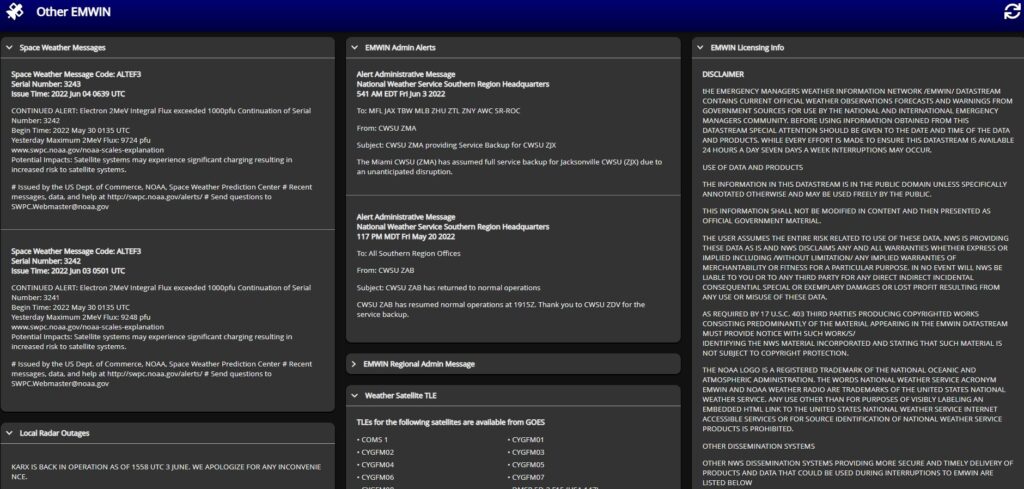
- Pertinent EMWIN data (which includes current weather conditions, forecasts, watches, and warnings) are presented to the user in a way that is appealing and easy to read. There is no need to parse through data for other locations: your configured location’s data is the only thing you’re shown. For a write-up on the EMWIN data Vitality GOES pulls and how it’s used, see here.
- It is able to monitor the status of the underlying goestools stack, including systems temps, error correction rates, and packet drop rates.
How does it work?
The following diagram shows how data flows from a GOES satellite, through Vitality GOES, and to the end-users:
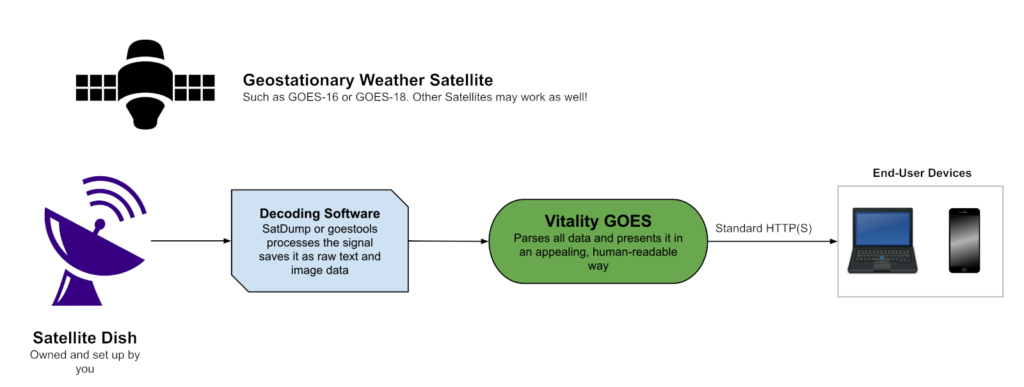
To put it simply: goestools and secondary scripts dump data to a folder on the ground station computer. From there, Vitality GOES reads the data and presents it to the user on their device across the local network.
A few examples running on my system while I was testing it.
Added the ability to display my composite Meteor Imagery
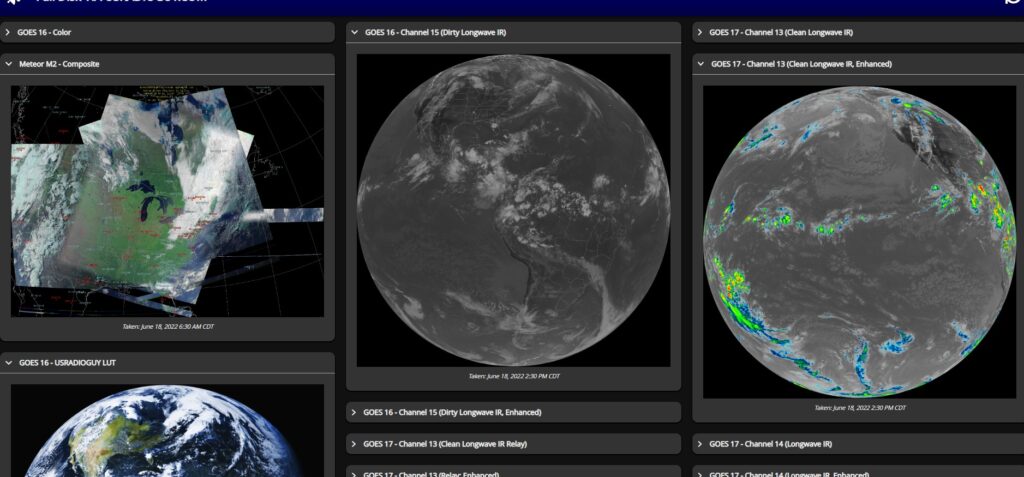
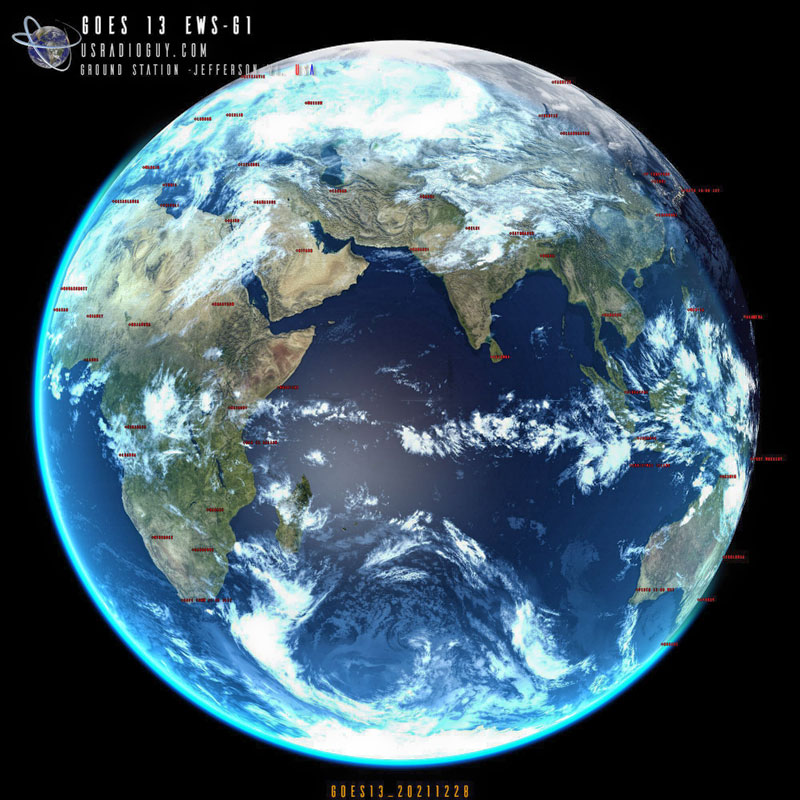
And the ability to display GOES 16, 17, and 18 (18 is from last weeks interleave tests)
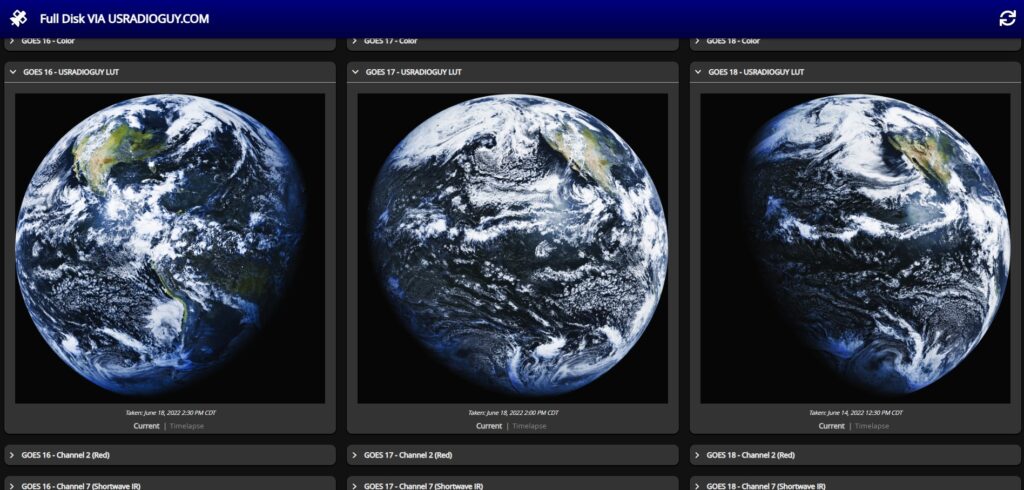
The software is highly configurable and with some tweaks to the css, script, you can really customize this to your own preferences as I did, shown below: