![]()
One of the fun parts of receiving satellite imagery is what you can do with the post-processing of the images. Map projections are mathematical models that allow us to represent a three-dimensional surface of the Earth on a two-dimensional map. There are many types of map projections, and each has its own set of advantages and disadvantages depending on the purpose of the map.
Cartography is the science and art of creating maps. The word “cartography” comes from the Greek words “chartis” meaning “map” and “graphein” meaning “to write”. Cartographers use a variety of tools and techniques to create maps that accurately represent the Earth’s surface, including satellite imagery, aerial photography, and GIS (geographic information system) software.
Maps are used for a variety of purposes, including navigation, land use planning, environmental analysis, and scientific research. Cartographers must consider the purpose of the map, as well as the intended audience when creating their maps. They must also take into account the inherent distortions that occur when representing a three-dimensional surface on a two-dimensional map. Through careful design and attention to detail, cartographers are able to create maps that are not only accurate but also aesthetically pleasing and easy to read.
In this example:
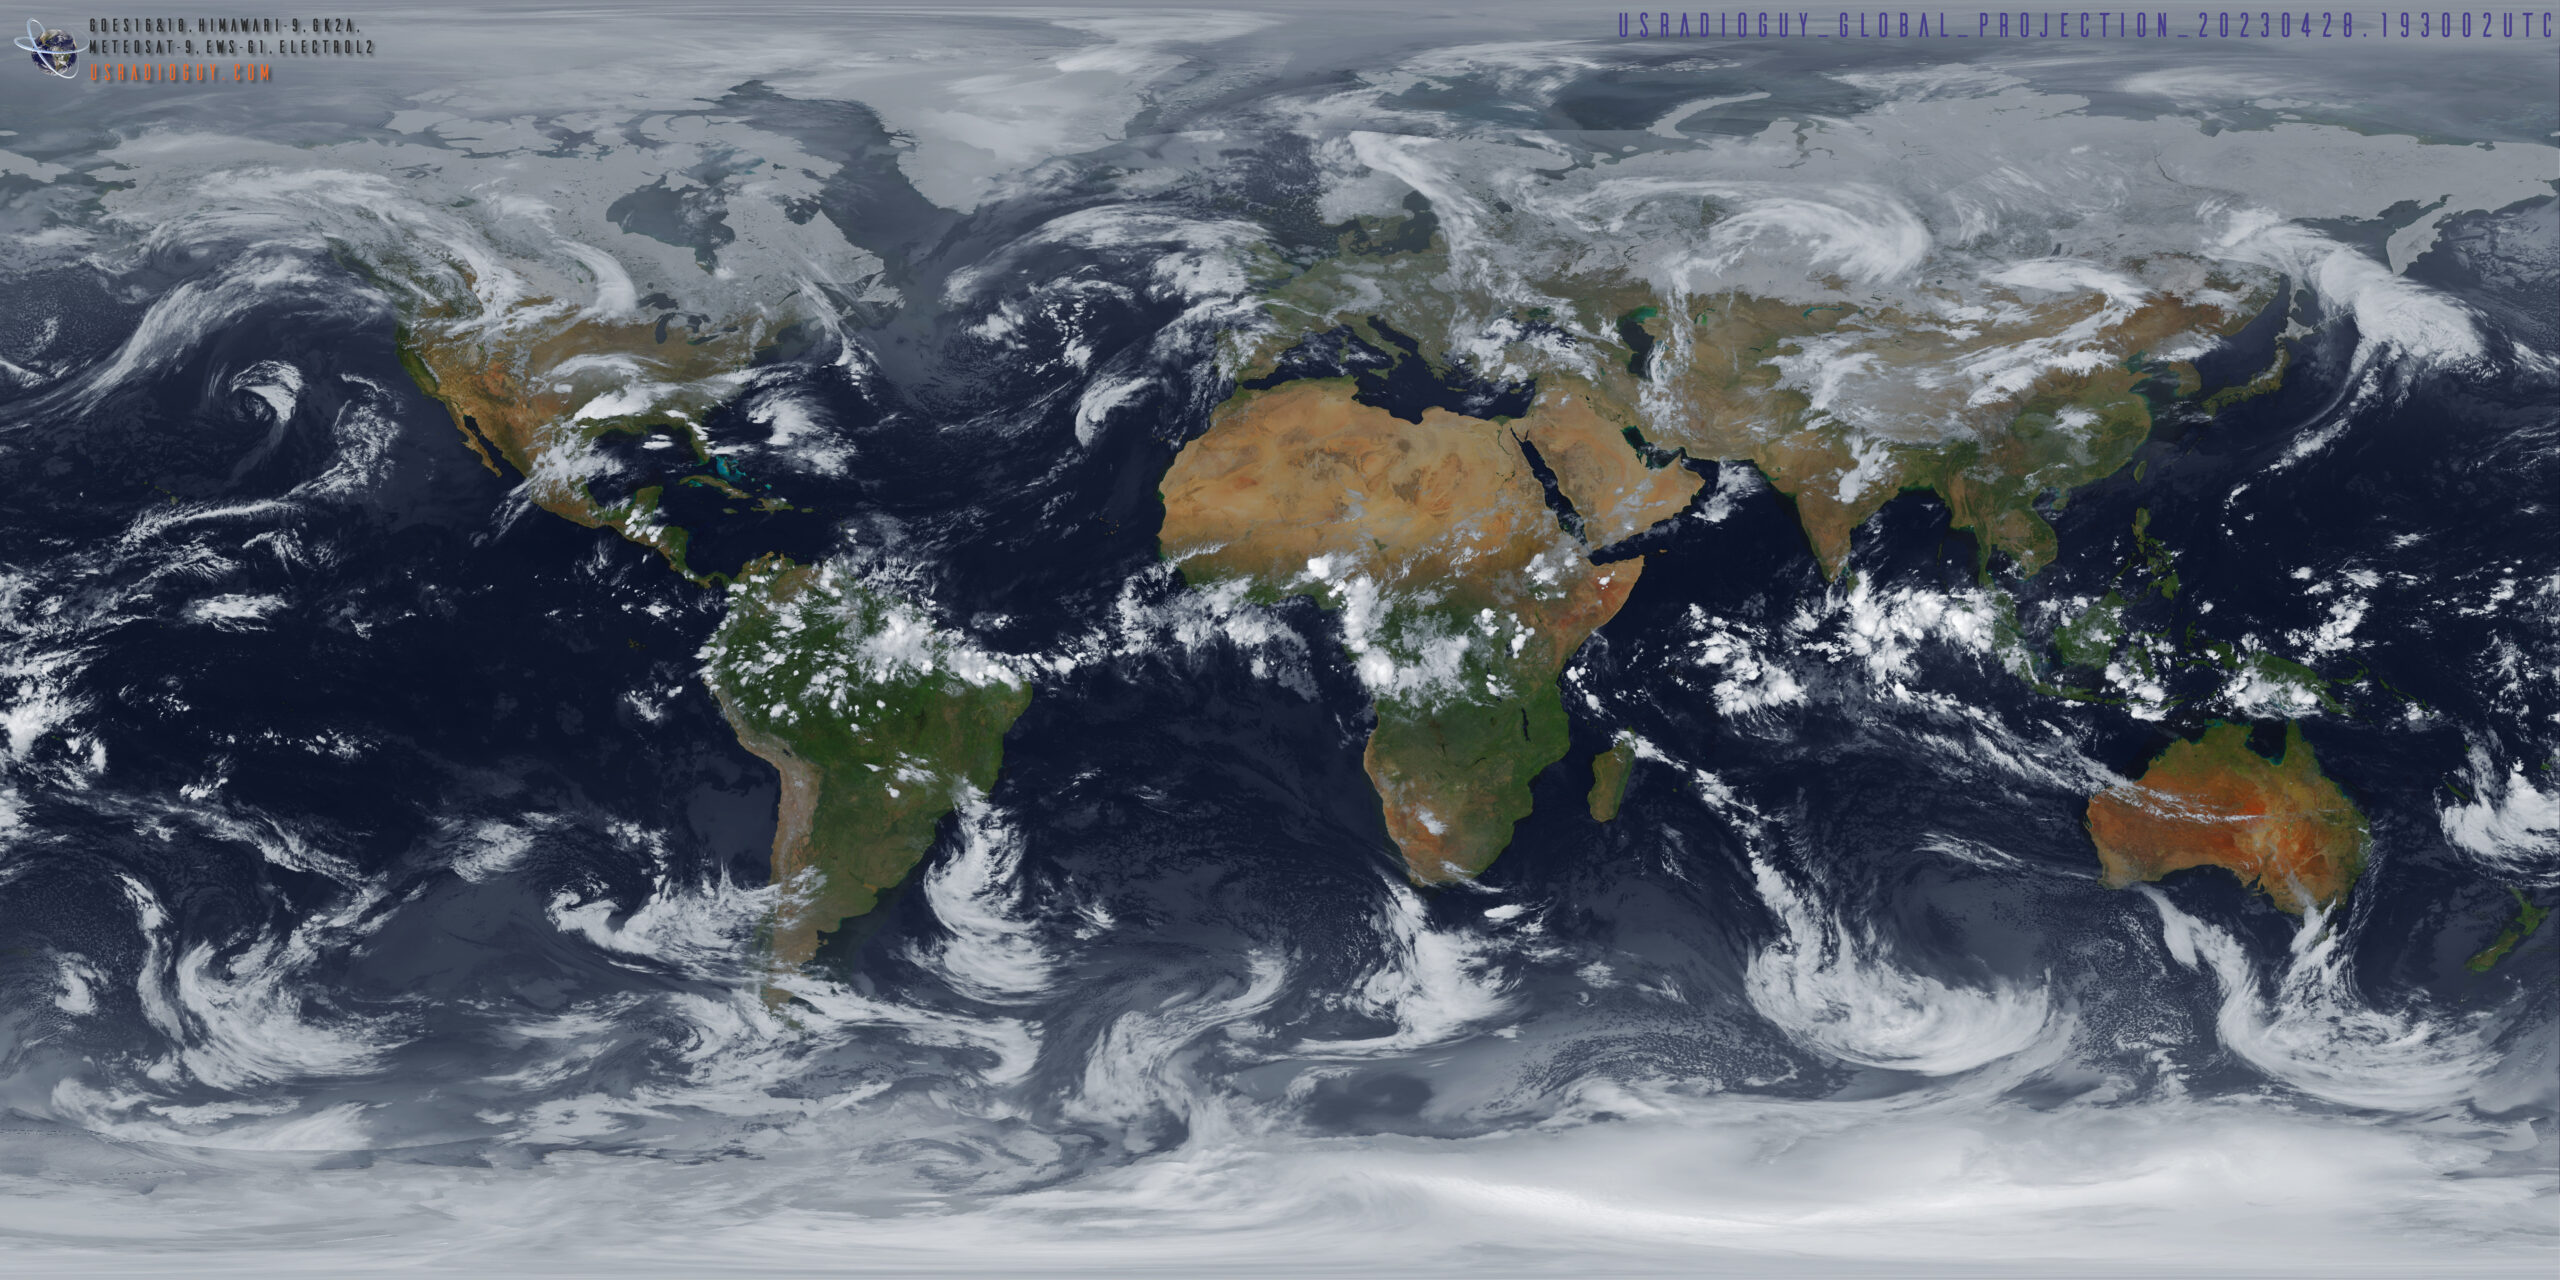
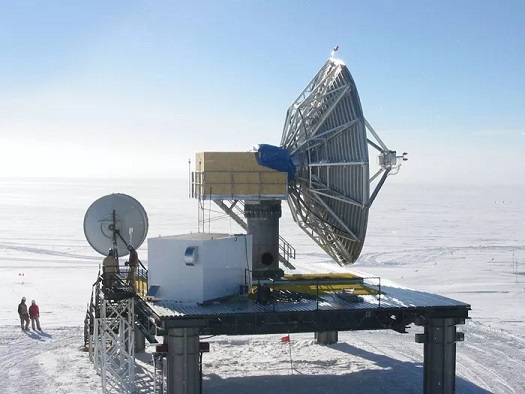
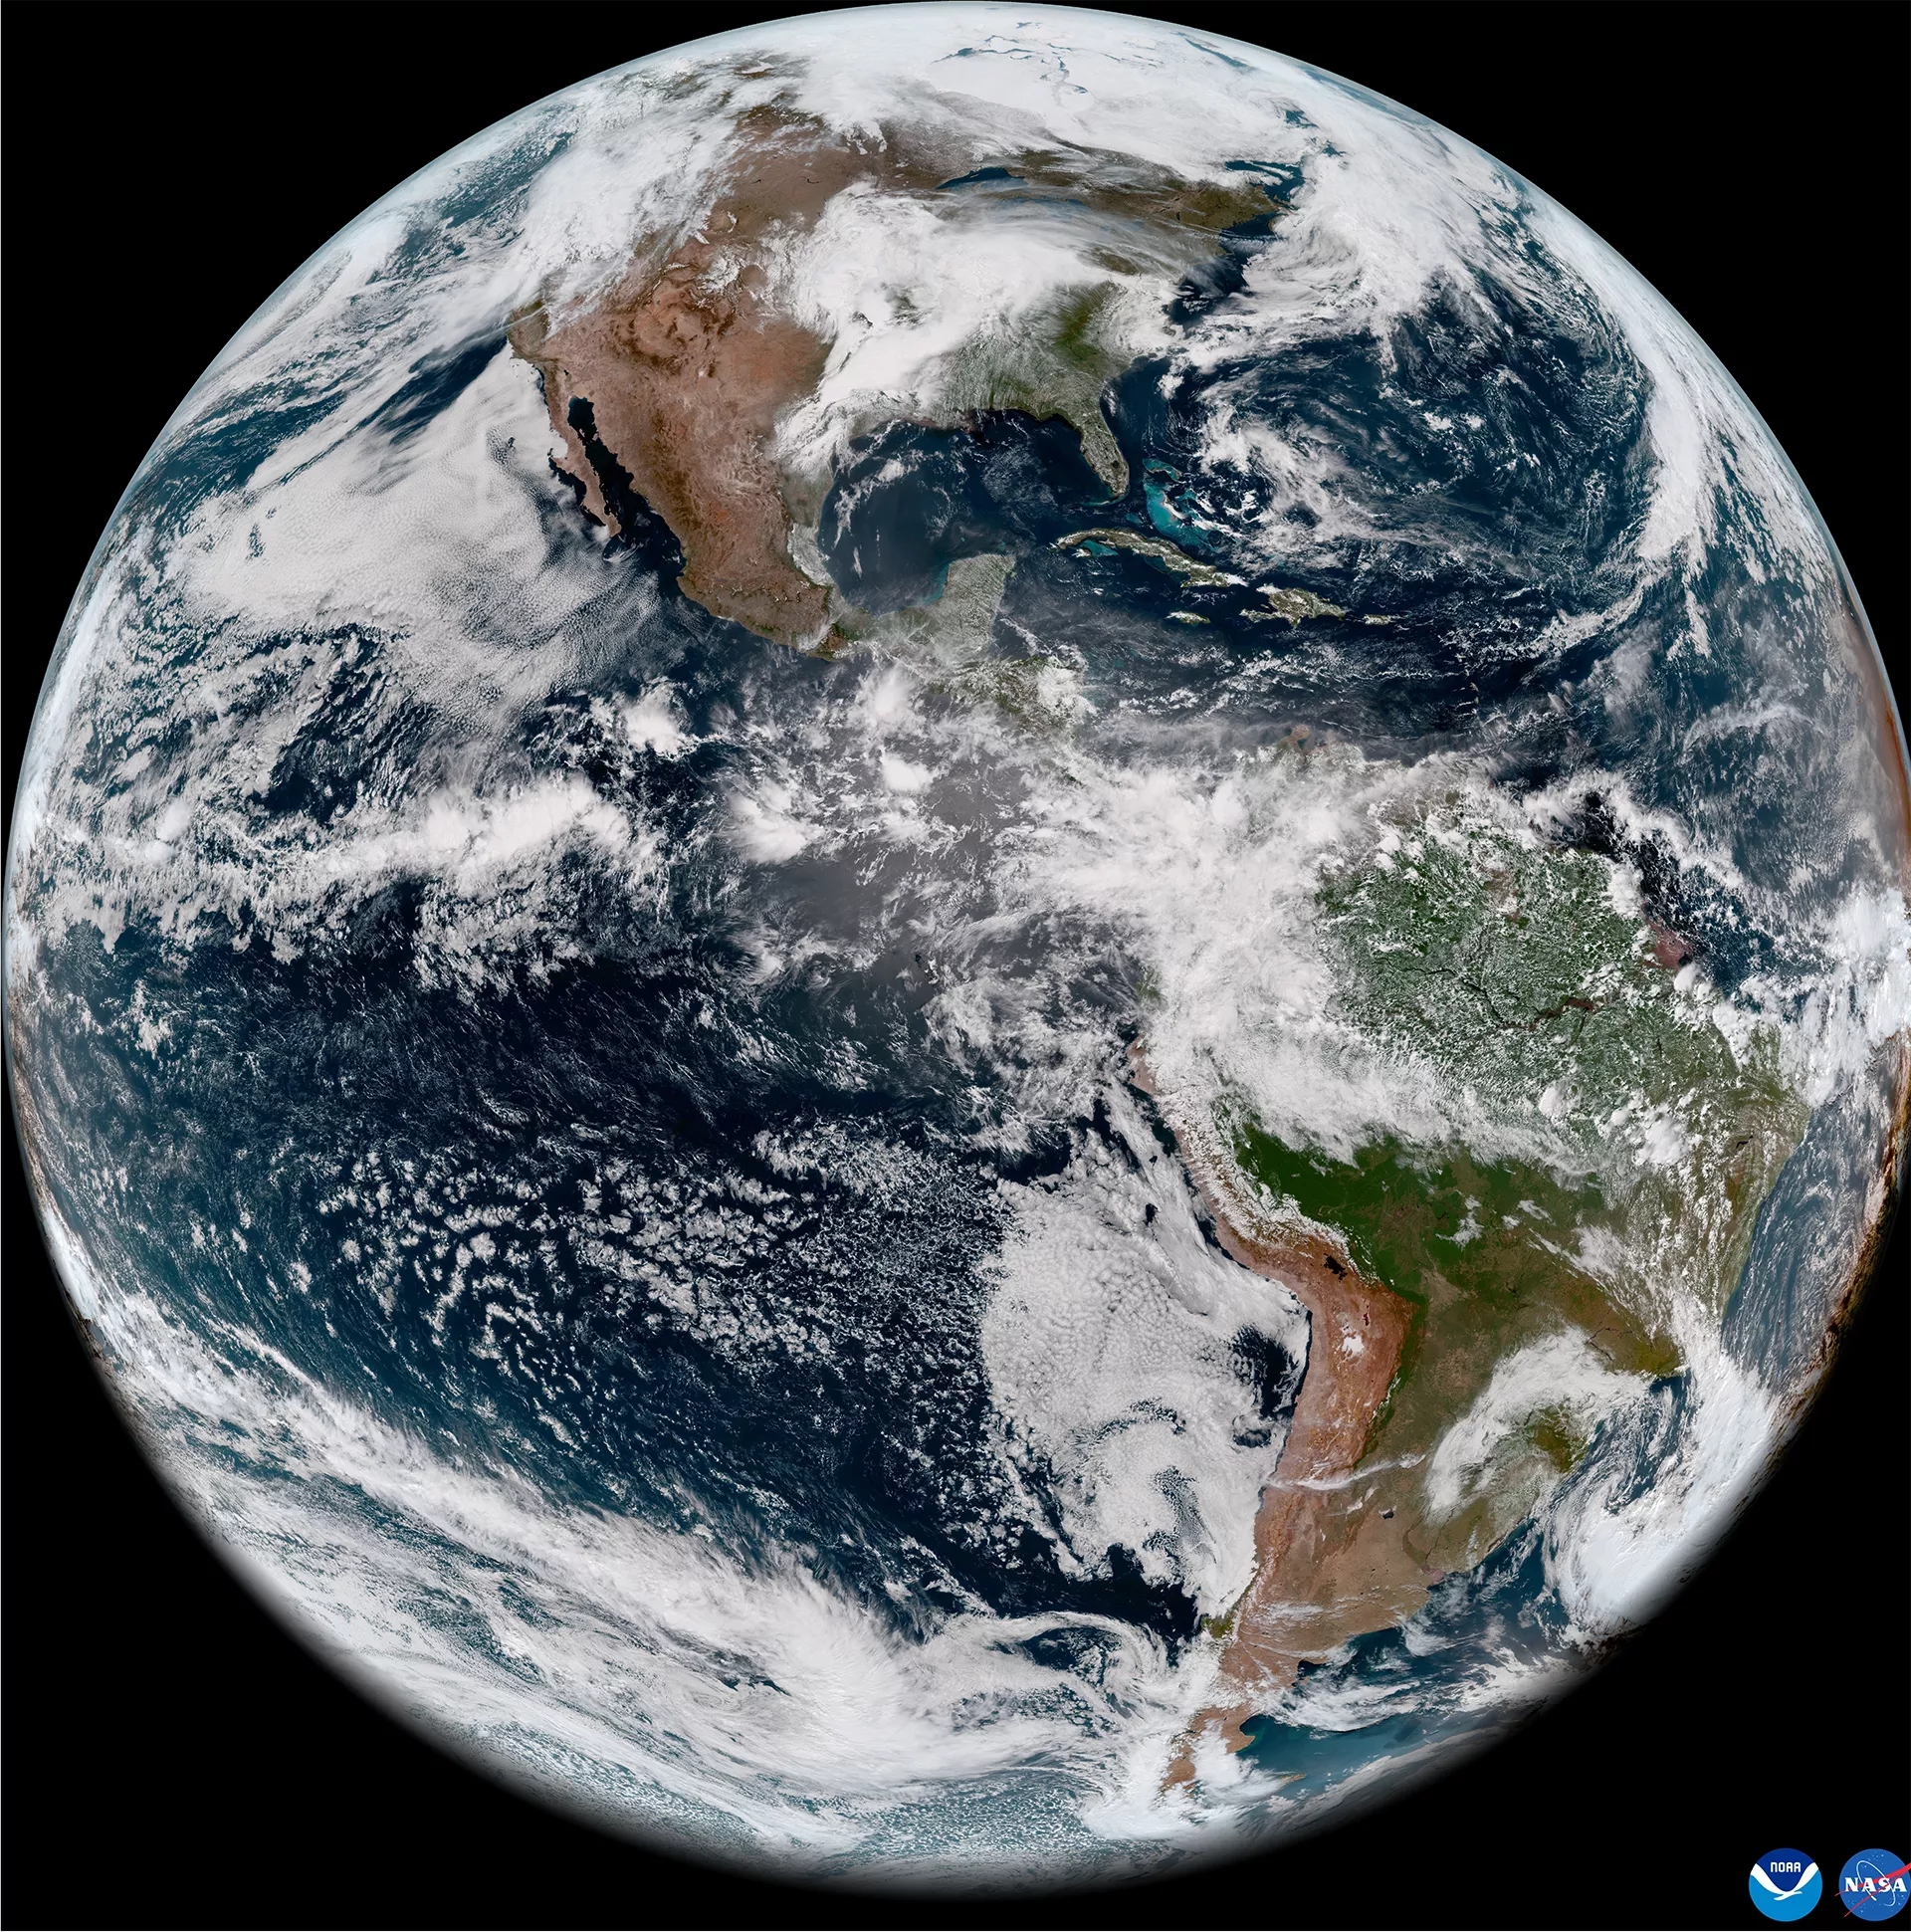
Created by stitching together imagery from 7 different Geo Satellites and then using Sanchez to create the base equirectangular projection. This was the base map I used with the software G.Projector from NASA.
Map projections are mathematical models that allow us to represent a three-dimensional surface of the Earth on a two-dimensional map. There are many types of map projections, and each has its own set of advantages and disadvantages depending on the purpose of the map.
One popular software for creating and visualizing map projections is NASA’s G.Projector. G.projector is free software that allows users to create, view and modify map projections in a variety of formats. https://www.giss.nasa.gov/tools/gprojector/
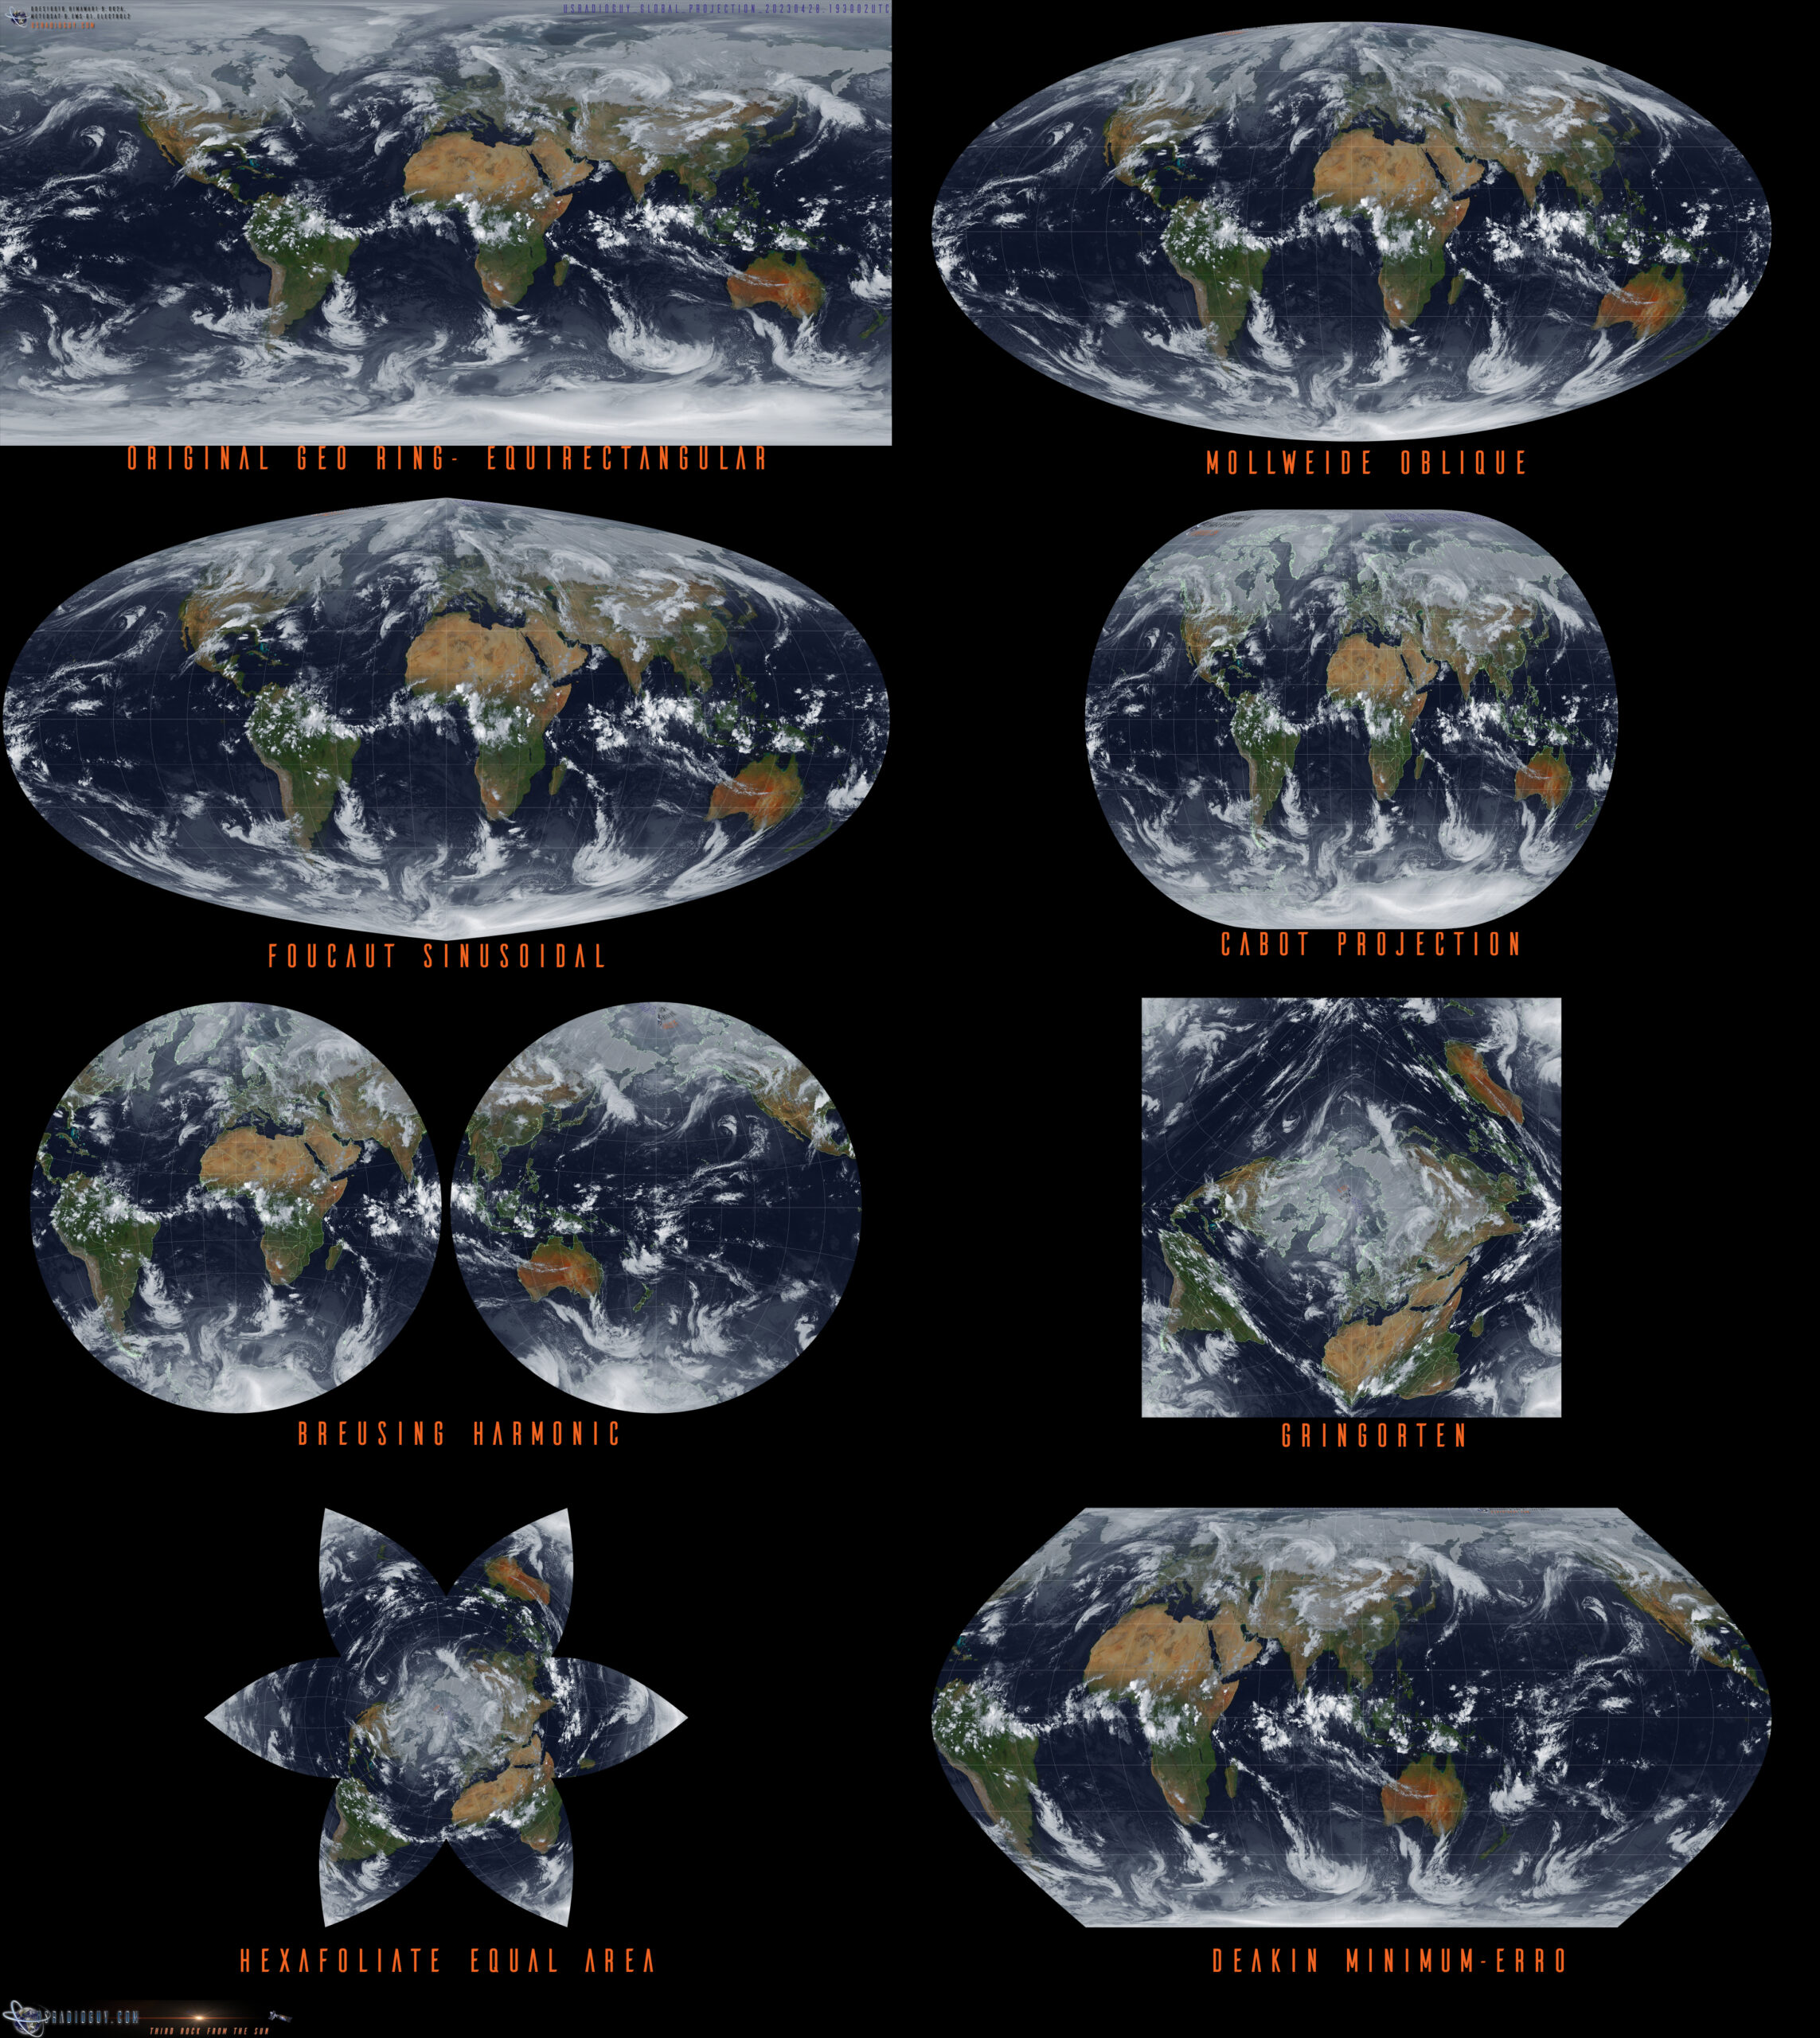
To use g.projector, users first need to open the map they wish to modify. If it is like mine above (equirectangular), then the default input coordinates will be correct. Feel free to download the image above and try it out! Next, choose the type of map projection you want to create. There are many available, including cylindrical, conic, azimuthal, and a wide selection of miscellaneous projections. Once the projection type is selected, users can then customize the projection parameters such as the central meridian, standard parallel, and map scale.
G.projector also allows users to add data to their maps, including vector and raster data. Users can import shapefiles, KML files, and GeoTIFFs and overlay them onto their map projections. Additionally, g.projector includes tools for adding annotations and legends to maps, allowing users to create fully customized, publication-quality maps.
One important consideration when working with map projections is distortion. Because we are representing a three-dimensional surface on a two-dimensional map, there will always be some distortion in the representation. Different map projections have different types and degrees of distortion, and it is important to choose a projection that minimizes distortion for the intended purpose of the map.
Map projections are essential tools for creating accurate and useful maps. NASA’s g.projector is a powerful and flexible software that allows users to create and visualize map projections in a variety of formats. When working with map projections, it is important to consider the purpose of the map and choose a projection that minimizes distortion for that purpose.