Skip to content
USRADIOGUY

USRadioguy.com

Welcome to USRadioguy.com – Unlocking the Potential of Software Defined Radio

  • Home
    • Home of USRadioguy
    • Tried and Tested Hardware
    • USRadioguy Newsletter
    • What is RTL-SDR?
    • Global Weather Data
  • Satellite Reception
    • Geo Stationary Satellites
      • Geo-stationary Satellite Imagery Reception
      • GOESTOOLS on the PI
      • Update Goestools for GOES 18,19
      • Receiving GOES with SatDump CLI Mode
      • GOES receiving in Windows for SatDump GUI
      • Decoding EWS-G1/EWS-G2
      • GOES GRB Reception WIP
      • Optimizing a WIFI Grid Antenna for Maximum Efficiency
    • APT Satellites
      • APT RECEPTION
      • Satdump for Meteor and NOAA decoding
      • METEOR M2- Series
      • WxtoImg Fix
      • Converting to new TLE format
      • Layering Fire and Hotspot Data on Meteor Sat Imagery
      • HRPT Satellite Tracking and Capture
    • Receiving Other Satellites
      • Inmarsat Decoding
      • Receiving the Funcube Amateur Satellite
    • User Maps and Dish Pointers
      • Satellite Dish Pointer
      • User Global Ground Station Maps
      • Usermap rendered with Cesium
      • Global Map of Govt Dish Stations
    • Satellite Details & Information
      • ORBITAL DYNAMICS 101
      • HRIT/EMWIN & GRB Defined
      • Mesoscale Imagery Defined
      • Viterbi, R/S Errors, Packets
      • GOES BAND IMAGERY
      • Stray Light Zone (SLZ)
      • Drifting a geostationary satellite
      • GOES-R Series Multimedia Tour
      • Online Satellite Imagery and Information
      • Satellite Frequencies
      • Solar and Space Weather
  • Satellite Imagery
    • IMAGERY- Current GOES East & West HRIT Satellite Imagery
    • IMAGERY- GOES 16&18 – Past 96 Hours of Imagery
    • High Resolution Imagery
    • Daily 3D view of Earth
    • PlanetMaker
    • GOES16 A full year of received imagery
  • Imagery Processing
    • Custom Color Lookup Table & Gradients
    • GOES-R Custom Imagery Scripts
    • Global geo-ring composites
    • MODIS VIIRS Global Coverage
    • 3D Satellite Tracking
    • The quest for True Color Imagery
    • 3D animation of realtime data
    • Layering Geo-Spatial Fire Data into Satellite Imagery
    • Orbital dynamics and the Moon
    • National Hurricane Data
  • News, VLOGS & BLOGS
    • News & USRadioguy Blogs
    • USRadioguy VLOGS
  • Project Lab
    • Orbital Information and Visualizations
      • Enhanced Planet Earth
      • Satellites in Orbit
      • Solar System
      • Objects in Orbit
    • Current Station Weather
      • Current Groundstation Weather
      • Global Weather Data
      • Space Weather
    • WWII RADIO
      • WWII K-24 Aerial Camera
      • WWII RADIO
      • RADIO SET SCR-284
      • VS-3 VIBRATOR CONVERSION
      • VIBRATOR CONVERSION MODULE
      • BD-71 Field Switch Board and EE-8B Field Telephones
      • R-100/URR 1944 MORALE RADIO
      • A PORTABLE WWII ERA “MORALE RADIO”
      • AN/GRR-5 THE ANGRY 5
      • WWII Audio Page
    • Raspberry Pi Projects
      • ADS-B Reception
      • Allsky Camera
      • Pi Based Picture Frame
      • PI Based Broadcastify Server
      • Solar Power for PI
    • Your very Own Weather Satellite
    • Hubble Space Telescope Data Processing
    • Zombie Satellites
    • DRONES
  • About Me
    • About Usradioguy
      • SETEC Astronomy
    • Tried and Tested Hardware
    • Rare Captures
    • My Other Interests
    • Presentations
    • Merchandise
    • Privacy Policy
  • Home
  • Science
  • False Color Imagery

False Color Imagery

Posted on June 9, 2024July 10, 2024 By Carl
Imagery Processing, Interesting stuff you should know!, Satellites, Science, Software

Loading

Spectral Imagery and False Colorization of Geostationary Satellite Data

Updated June 9th 2024

Geostationary satellites like GOES, Himawari, Meteosat, FENGYUN, and Elektro primarily acquire imagery in various infrared (IR) bands along the electromagnetic spectrum. While some possess limited visible band capabilities (typically blue and red), these are often desaturated and not used for generating true-color images.

The absence of a green channel impedes the creation of natural-looking color composites. However, most processing software utilizes at least three bands (two visible and one IR) to generate a “false-color” image through a process known as color mapping. This involves assigning pseudo-colors to specific IR wavelengths based on their correspondence to observed features.

HRIT (High Rate Information Transmission) data users have a single visible band (typically band 02) available. Combining this with an IR band (e.g., band 13) and applying a Look-Up Table (LUT) allows for the creation of a reasonable false-color image.

However, this approach presents challenges. LUTs rely on reflected ground temperatures to assign colors, which can lead to a systematic bias. For instance, higher latitudes tend to appear excessively blue during winter months due to colder ground temperatures. While increasing color saturation can improve the appearance of these regions in winter, it can also lead to the oversaturation of cloud features.

One strategy to mitigate these limitations involves the development of custom LUTs, as you have done for GOES satellites, which aim to balance the color representation across seasons.

An alternative approach, employed by agencies like EUMETSAT, NOAA, and NWS, involves incorporating an underlay image as a background. This underlay typically originates from high-resolution, true-color imagery acquired by polar-orbiting satellites. This composite approach leverages the strengths of both geostationary and polar-orbiting platforms to provide a more informative and visually appealing representation of the Earth.

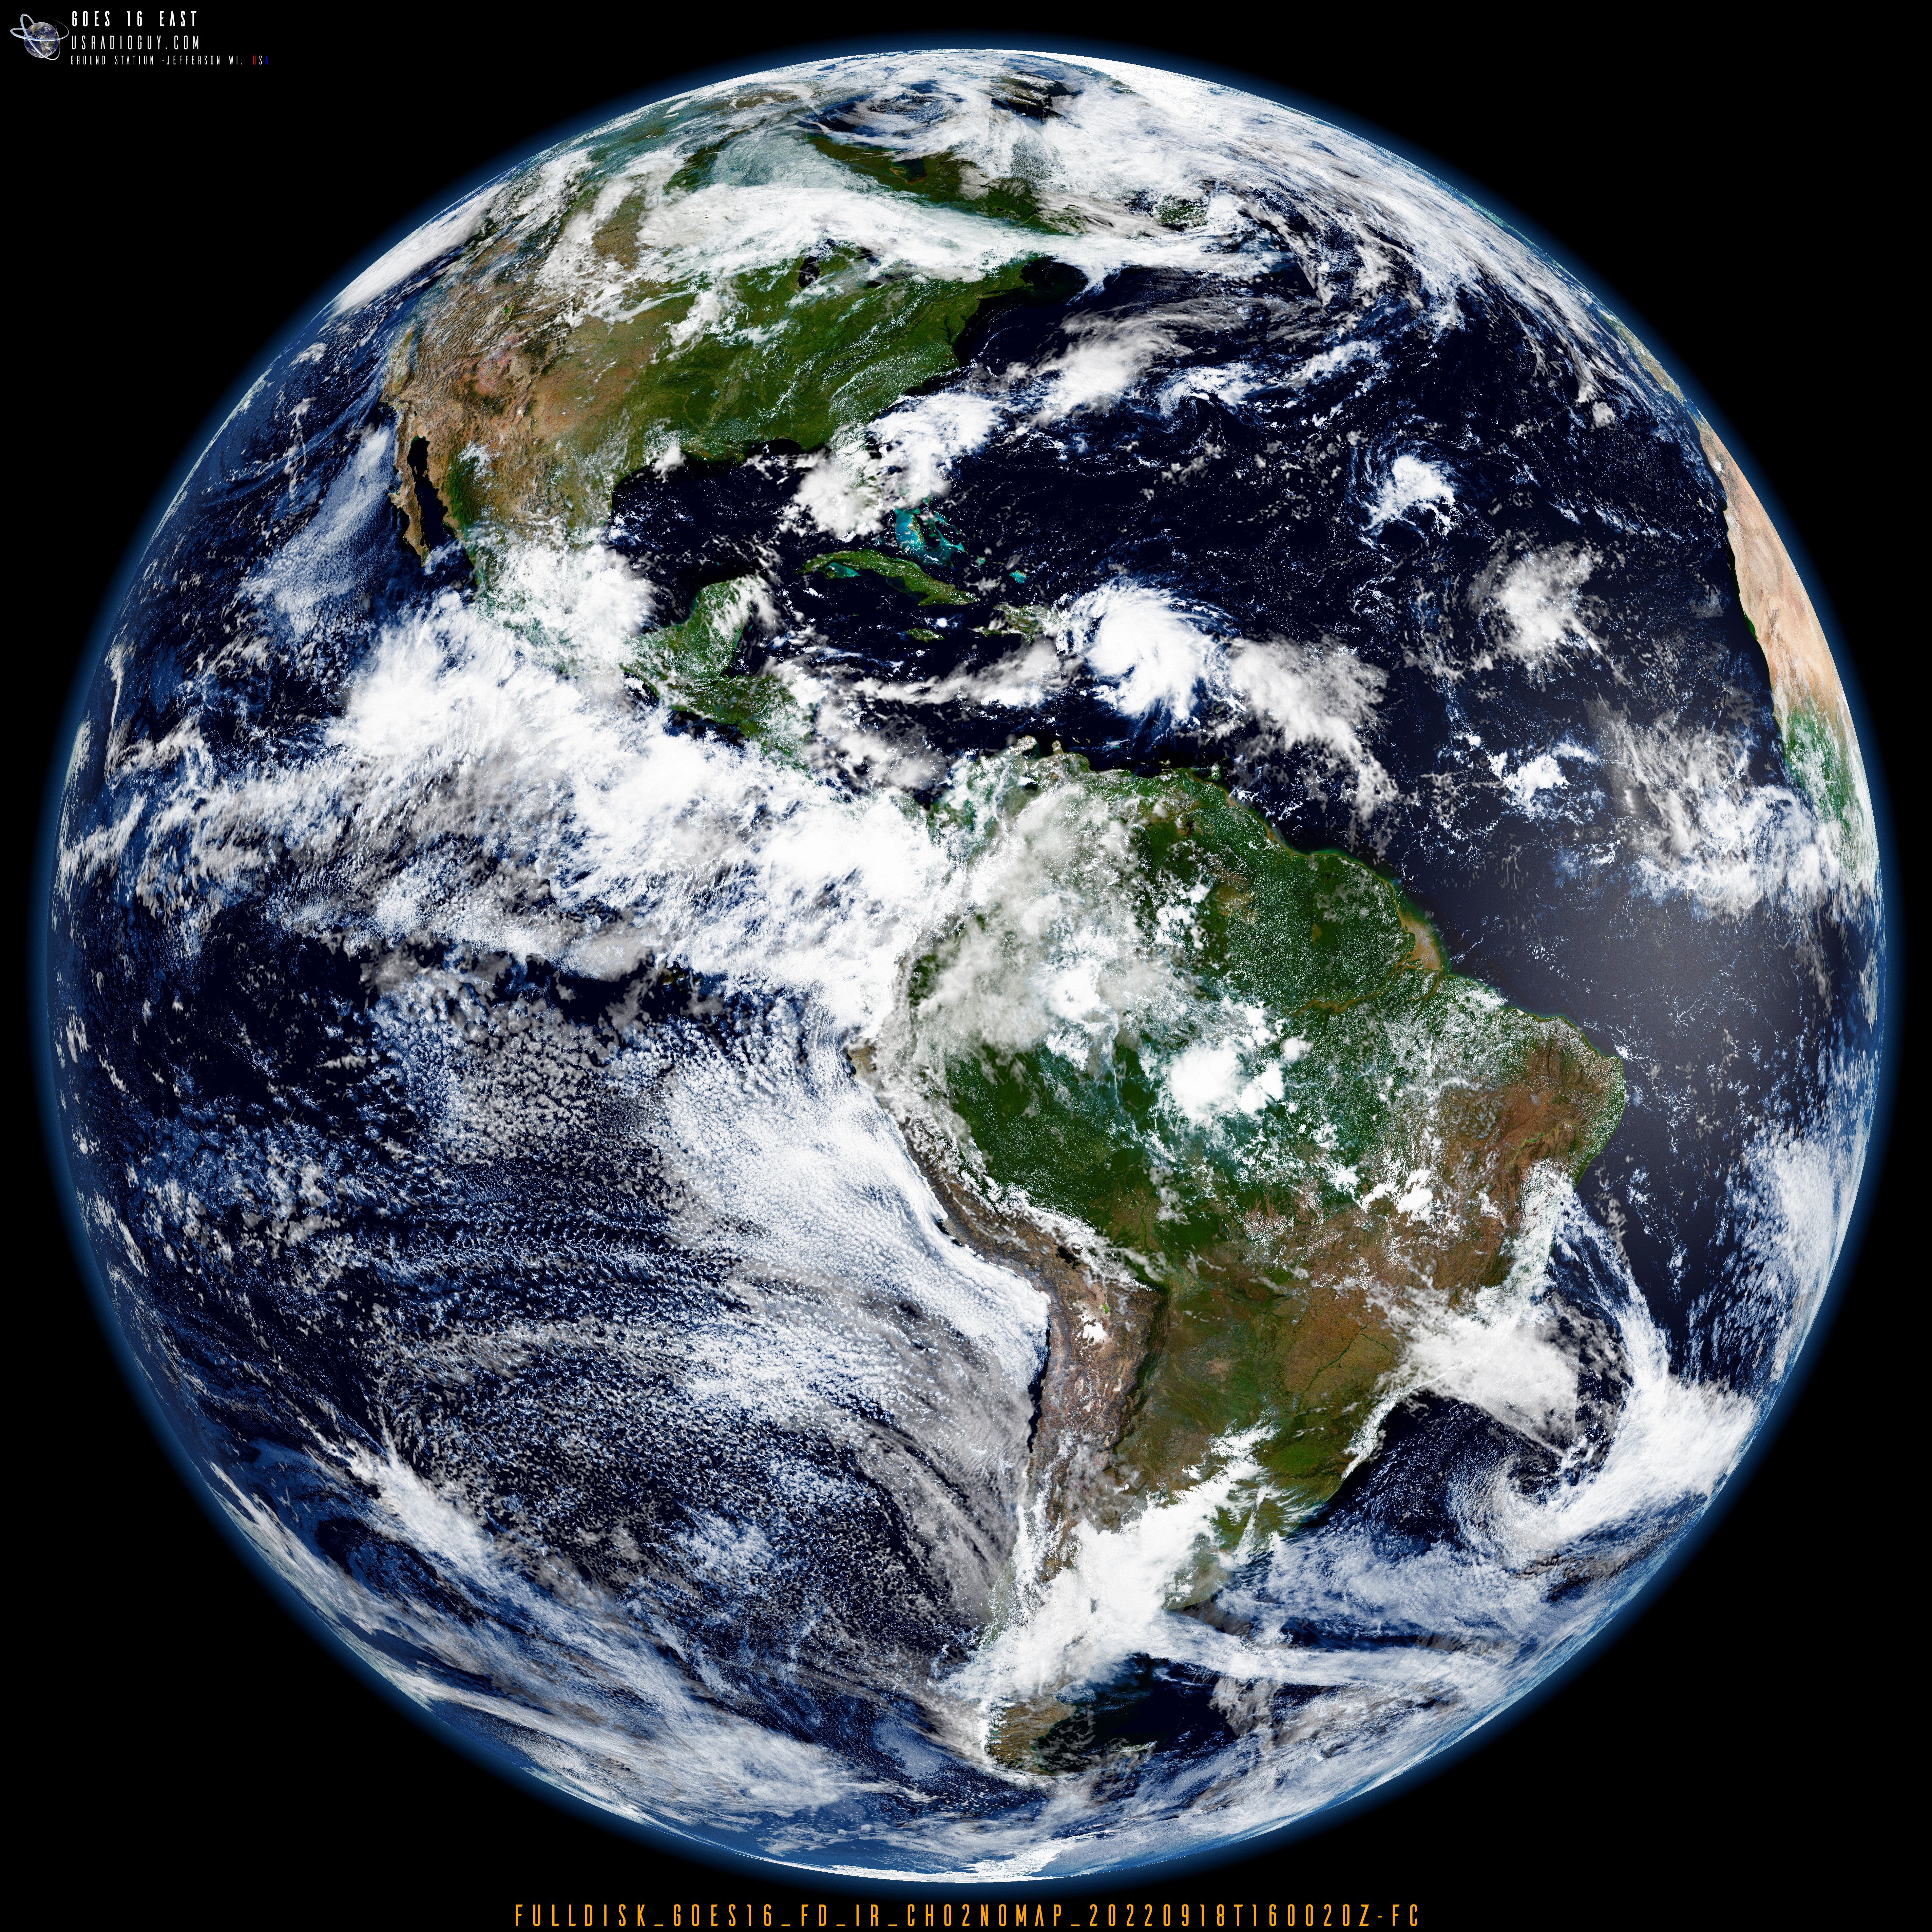
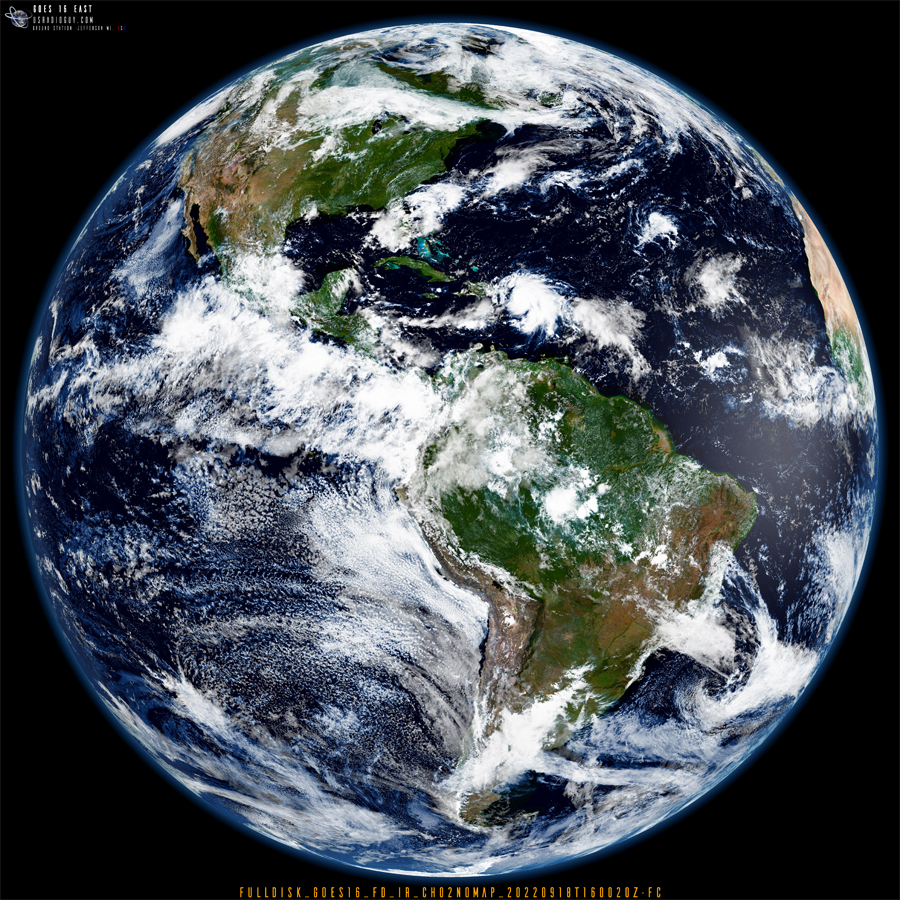
Using Sanchez as just one part of a series of processes allows me to create some really stellar views of earth, coming close to that Tru-Color imagery from only HRIT greyscale images. In the animation below, you can see the results of this multi layered process which is listed next.

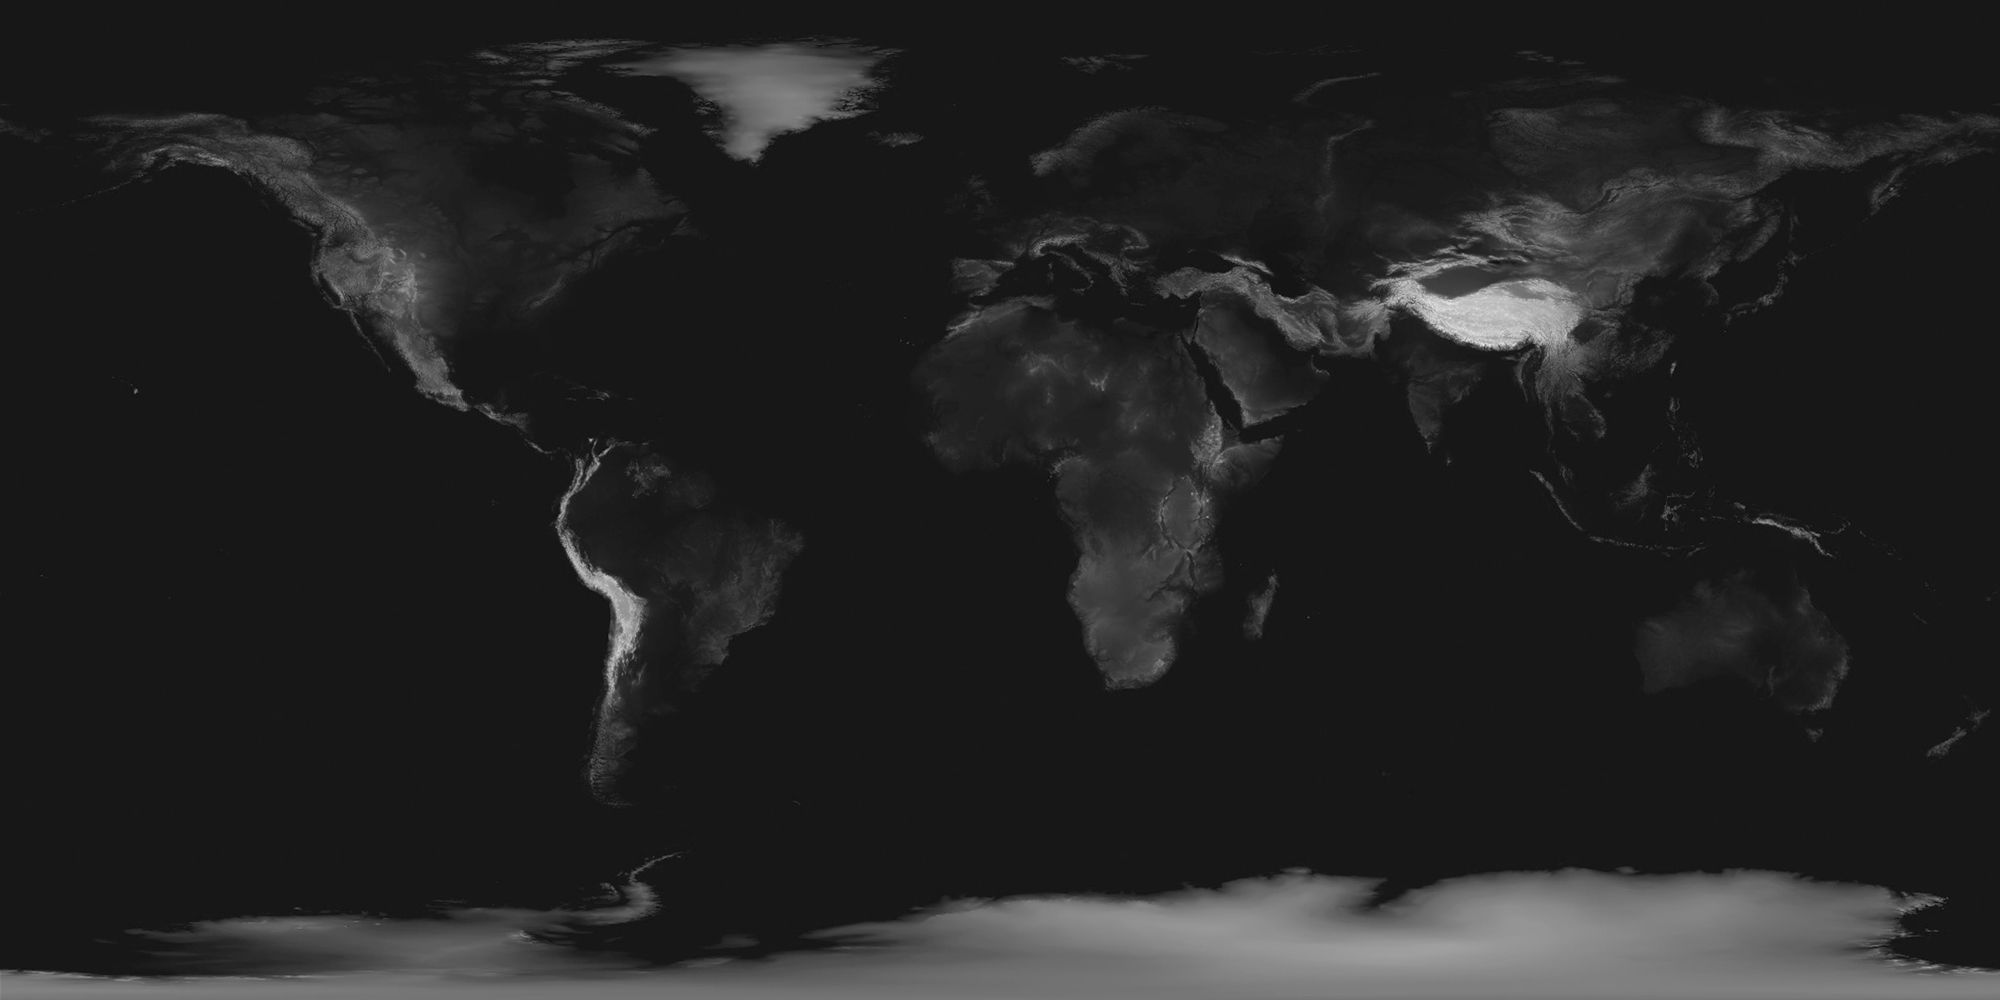
This animation uses many different subroutines, utilizing software such as ImageMagick, FFMPEG, Sanchez, and Xplanet. I use an Xplanet subroutine to generate a dynamic background that is time synched by date and time UTC, and timed to create a matched day/night underlay. The underlay is comprised of two global images of earth, one, the daylight view is from the NASA Visible Earth Project using the most clear and detailed imagery I can find. The nighttime imagery is from the Suomi NPP polar orbiter, showing the earth at night. This is then combined with two bands of imagery, both visible band 02, and IR band 13. I use both bands because if I used just the visible, the night side would have no cloud layers as it would be black.

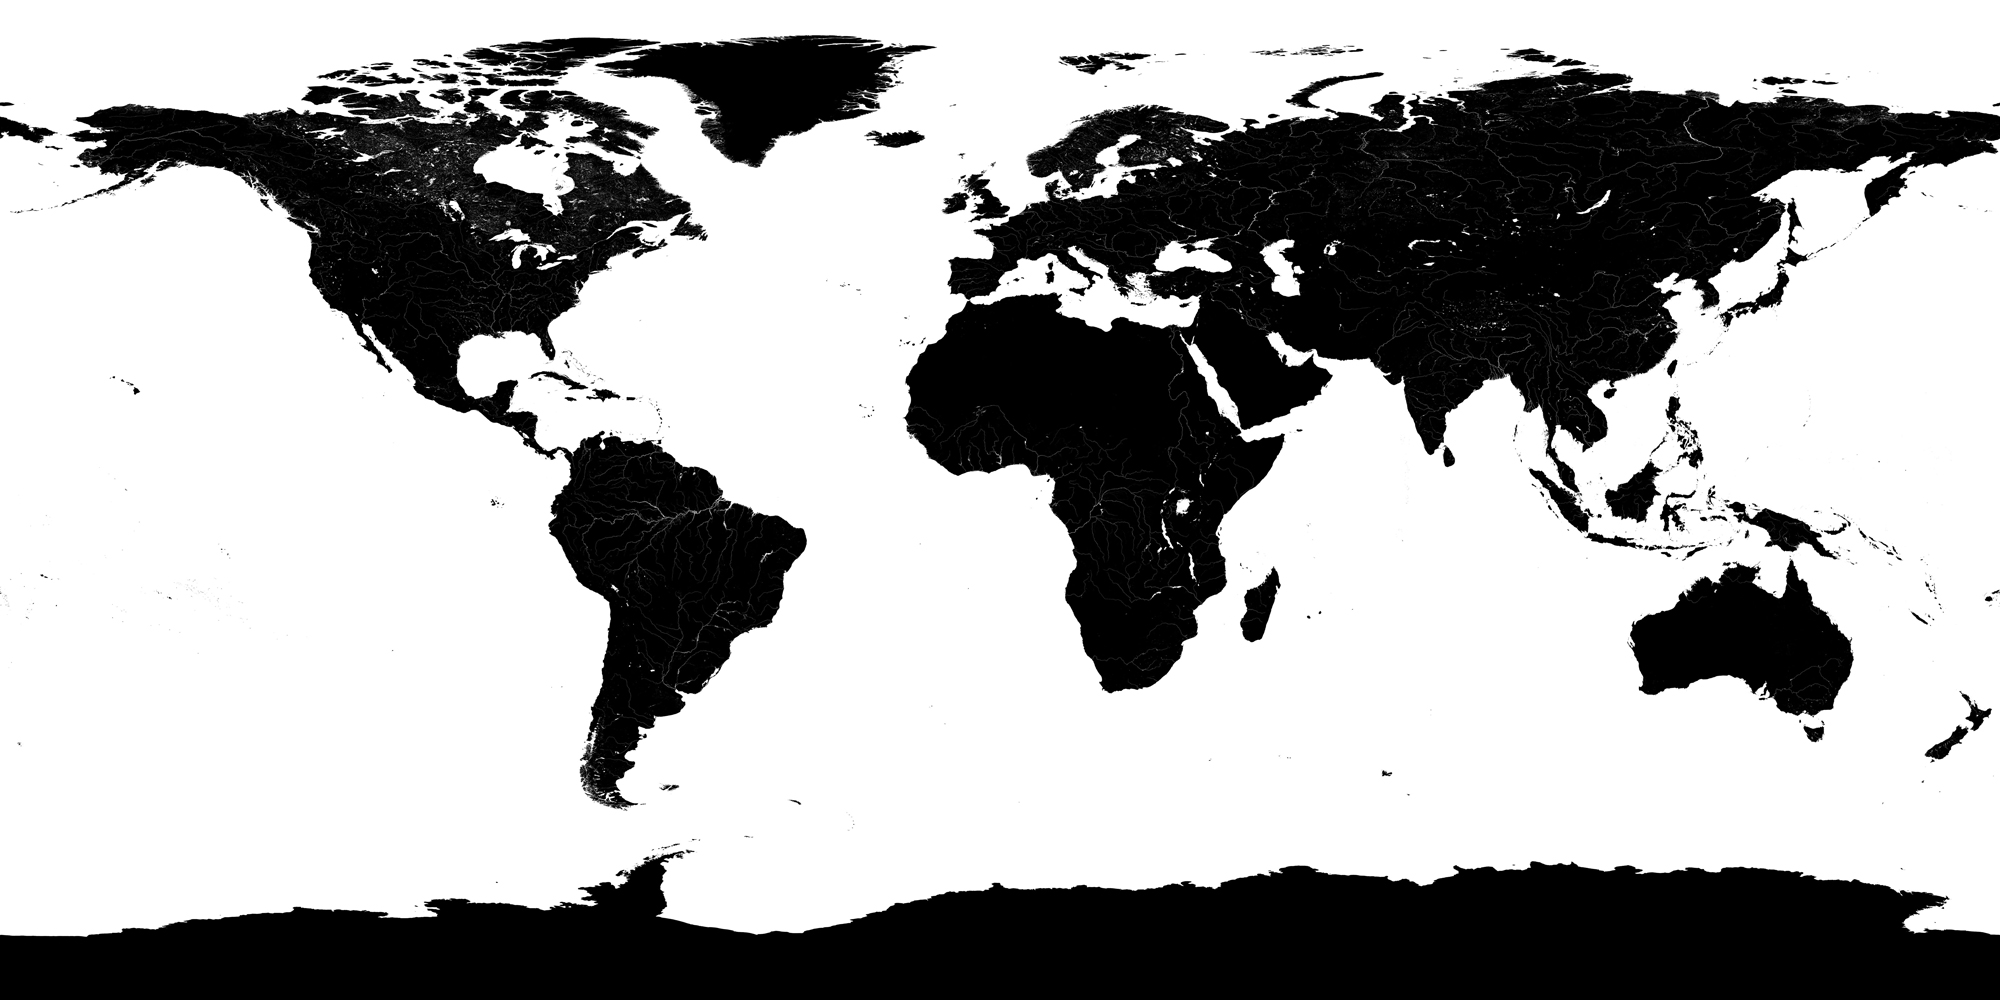
ELEVATION DATA – The underlay also utilizes a few more features. I use elevation data of the landmasses of Earth to build a “bump map” which gives a little more 3D detail to the planet, and allows accurate shadows to fall across mountain ranges and valleys (which can be seen in the animation, especially along the Andes mountain range).

Sample of the Earth Elevation, or Bump Map, I use for elevation data.

SPECULAR LIGHTING – Specular Lighting is also used to reproduce sunglint, also called a specular reflection, this creates a glint of sunlight reflection on all water surfaces, lakes, rivers, and oceans utilizing yet another ‘map’ known as a specular map. This mirror-like reflection, known as the specular point, is processed by time and date with known keplerian planetary and solar data to show the reflection of the sunlight as closely as possible as the earth moves in orbit, in relation to the position of the sun.

Sample of the specular map I use, If you open it fully you will see every river, lake, and ocean in white which the program uses to create the sun glint. Everything in black is ignored.

RAYLEIGH SCATTERING
The last process done to the imagery is to apply a subtle rayleigh light scattering effect. Rayleigh scattering refers to the scattering of light off of the molecules of the air, and can be extended to scattering from particles up to about a tenth of the wavelength of the light. It is Rayleigh scattering off the molecules of the air which gives us the blue sky we see. The software needs to create this effect by first creating ‘scattering’ tables

Tables are calculated for fixed phase angles (satellite latitude and longitude – ground point – sun angle). For lines of sight intersecting the disk, the tables are a 2D array of scattering intensities tabulated as a function of incidence (the zenith angle of the sun seen from the vantage of the satellite) and emission (the zenith angle of the observer seen from the vantage of the satellite) angles.

Tables are created at each degree between 0 and 180 degrees for the limb and between 0 and 90 degrees for the disk using the incidence, emission, and tangent height values specified:
For my projections, I use these values:

Planetary radius of 6378.140 km
Atmospheric scale height8000 meters*
Index of refraction of air1.000293
The density of air at the reference level,
in molecules/cubic meter
2.6867774e25**
* I know our atmosphere extends much past this, but increasing this factor really causes some weird false atmospheric artifacts)
**(changing this can result in the atmosphere looking like watery milk!)

Below is the process chart that outlines the steps in the creation of these types of images and animations:

Below is a reduced static image created with the above process, clicking on it will open it up in a new window that you can zoom better.

Post navigation

❮ Previous Post: GOES-U to Launch in June
Next Post: What will the neighbors think? ❯

You may also like

Interesting stuff you should know!
Update – Goes 16 to19 Transition to Operations
March 4, 2025
Humor
Attack Squirrels
November 25, 2020
Hardware
GEONETCast Americas
July 7, 2024
USRadioguy render of Earth
Imagery Processing
Satellite Processing-Science vs Art:
April 25, 2024

Please, Help Support USRadioguy.com

If you like what I do please support me on Ko-fi, It really means a lot, every bit helps!

Hardware Humor Imagery Processing Interesting stuff you should know! Launch News Life News Product Review Satellites Science Software Space Weather Uncategorized VLOG

Alphabetical Listing of all Pages on site:

  • 36-Hour Imagery Processing script
  • 3D animation of realtime data
  • A PORTABLE WWII ERA “MORALE RADIO”
  • About Me
  • ADS-B Reception
  • Allsky Camera
  • AN/GRR-5 THE ANGRY 5
  • BD-71 Field Switch Board and EE-8B Field Telephones
  • Current GOES 16 & 18 False Color Satellite Imagery
  • Custom Color Lookup Table
  • Custom Imagery Scripts for GOES
  • Daily 3D view of Earth
  • Daily Global Composites
  • Decoding EWS-G1 or GOES-13
  • Drifting a geostationary satellite
  • DRONE FUN
  • Even the kitchen sink
  • GEO-RING COMPOSITES
  • GEO-SAT PI FRAME
  • Geo-stationary Satellite Imagery Reception
  • Global Weather Data
  • GOES 19&18 – Last 96 Hours of Imagery
  • GOES BAND IMAGERY
  • GOES GRB Reception
  • GOES receiving in Windows for SatDump
  • GOES-18 Preparing for a new satellite
  • GOES-R Series Multimedia Tour
  • GOES-U (19) Countdown to Launch
  • GOES16 A full year of received imagery
  • Ground Station Map
  • High Resolution Imagery
  • Home
  • House History
  • HRIT/EMWIN & GRB
  • HRPT Satellite Tracking and Capture
  • Hubble Space Telescope Data Processing
  • Inmarsat Decoding
  • Layering Fire and Hotspot Data on Meteor Sat Imagery
  • Layering Geo-Spatial Fire Data into Satellite Imagery
  • Mesoscale Imagery Defined
  • METEOR M2- Series
  • MODIS VIIRS Global Coverage
  • My Other Interests
  • NASA, NOAA, Military, GOVT dish, and tower stations.
  • National Hurricane Data
  • Newsletter terms & conditions
  • NOAA & Meteor APT and LRPT RECEPTION
  • Online Satellite Imagery and Information
  • Optimizing a WIFI Grid Antenna for Maximum Efficiency
  • ORBITAL DYNAMICS 101
  • Orbitron, Gpredict, and PSTRotator with new TLE format
  • PI Based Broadcastify Server
  • Pi Based Picture Frame
  • Presentations
  • Privacy Policy
  • Programming the PI for goestools operation
  • R-100/URR 1944 MORALE RADIO
  • RADIO SET SCR-284
  • Rare Captures
  • Receiving GOES 18,19 with goestools
  • Receiving GOES HRIT with SATDUMP
  • Receiving the Funcube Amateur Satellite
  • Satdump for Meteor and NOAA decoding
  • Satellite Finder
  • Satellite Frequencies
  • Satellite Ground Stations
  • Satellite Tracking
  • Security
  • SETEC Astronomy
  • Solar Power for PI
  • South America GOES 16
  • Space Weather
  • Stray Light Zone (SLZ)
  • Thanks!
  • The quest for True Color Imagery
  • Tried and Tested Hardware
  • Usradioguy Blogs
  • Usradioguy Merchandise
  • USRadioguy Newsletter
  • USRadioguy VLOGS
  • USRADIOGUY Youtube Page
  • VIBRATOR CONVERSION MODULE
  • Viterbi, R/S Errors, Packets
  • VS-3 VIBRATOR CONVERSION
  • What is RTL-SDR?
  • WWII Audio Page
  • WWII K-24 Aerial Camera
  • WWII RADIO
  • WxtoImg Fix
  • Your very Own Weather Satellite
  • Zombie Satellites

Hardware Humor Imagery Processing Interesting stuff you should know! Launch News Life News Product Review Satellites Science Software Space Weather Uncategorized VLOG

Satellite And Weather Related Feeds

  • CIMSS Satellite Blog
  • USRadioguy.com
  • wildfires
  • NASA Earth Observatory
  • SPC Particularly Dangerous Situation (PDS) Tornado/Severe Thunderstorm Watch
  • satellites
  • Satellites News -- ScienceDaily
  • Satellite Liaison Blog
Resuspended volcanic ash from the 1980 eruptions of Mount St. Helens
Outbreak of tornadoes across North Dakota
Post-Tropical Cyclone Kiko north of Hawai’i
SatDump 2.0
SatDump 2.0
WXtoIMG: A Legacy in Weather Satellite Decoding
NOAA 15 and 19 Decommisioning
The fire cycle
New NOAA tool can predict potential wildfires on an hourly basis
Unmasking the complicated chemistry of wildfire smoke: What's in it?
By the Warm Light of the Moon
Arctic Sea Ice Ties for 10th-Lowest on Record
Cooper Creek Replenishes Lake Eyre
SPC PDS Severe Thunderstorm Watch 399
Experts to preview launch of historic NOAA space weather satellite observatory
Five historically huge solar events
65 years since the world’s first weather satellite
Hubble just revealed the fiery heart of the Cigar Galaxy
This rare white dwarf looks normal, until Hubble shows its explosive secret
A weirdly shaped telescope could finally find Earth 2. 0
Hurricane Erin: East Coast Impacts and Extratropical Transition
Hurricane Erin (2025) Rapid Intensification
August 2025 Milwaukee Flooding
  • Facebook Geo Stationary Satellites
  • Usradioguy Facebook
  • Instagram
  • Reddit
  • Github
  • Linkedin

Copyright © 2025 USRadioguy.com - All Rights Reserved. All material protected by Fair Use Section 107 of the Copyright Act. This site is Verified and Secured with 256 bit SSL encryption

Help Fund USRadioguy.com

USRadioguy Needs Your Help